
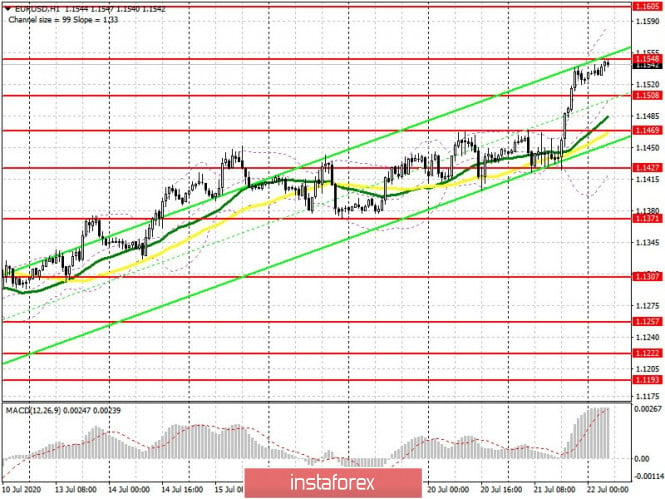
To open long positions on EUR/USD, you need:
The news about the breakthrough in the development of a vaccine against COVID-19 and the decisions made at the EU summit woke up the bulls, who began to buy the European currency in batches during the US session, creating several signals to open long positions. Let's take them apart. If you look at the 5-minute chart and recall yesterday's recommendations, you will see how the bulls broke through and consolidated above the resistance of 1.1466, which formed the first signal to buy the euro. As a result, the pair quickly reached the resistance of 1.1514, where after a short stop, another entry point into long positions was formed. This pulled EUR/USD under the resistance of 1.1539, where it was possible to observe partial profit-taking. At the moment, euro buyers are looking for the 1.1548 level, consolidating above it will lead to forming a new signal to open long positions in continuing the bullish trend with an update to the high of 1.1605. A large resistance at 1.1648 is still the long-term goal, where I recommend taking profits. In the event of a downward correction, and this is quite acceptable due to the lack of important fundamental data in the morning, it is best to postpone long positions until an update of the low of 1.1508, with the condition of forming a false breakout there. Otherwise, I advise opening long positions only for a rebound from the support of 1.1469, where the moving averages are also based for a rebound of 25-30 points within the day. Let me remind you that the Commitment of Traders (COT) report for July 14 recorded an increase in long positions and a very small rise in short ones, which indicates a gradual increase in demand for risky assets. There are more and more people willing to buy euros in current conditions and at high prices, which may lead to further growth in the medium term. The report shows an increase in short non-commercial positions from the level of 881,562 to the level of 83,340, while long non-commercial positions jumped from the level of 185,159 to the level of 194,252. As a result, the positive non-commercial net position increased to 110,912, against 103,597, which indicates an increase in interest in purchasing risky assets at current prices.
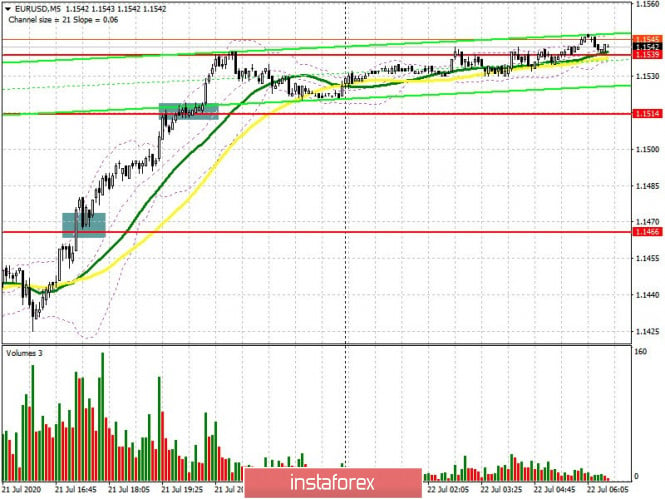
To open short positions on EUR/USD, you need:
Sellers tried to return to the market several times yesterday, even forming a sell signal for the euro in the morning, which I analyzed in detail. However, this did not lead to a larger bearish sell-off. At the moment, sellers are focused on protecting the 1.1548 resistance, forming a false breakout there in the morning and returning to this range will be a signal to open short positions while expecting a downward correction to the support of 1.1508. However, an imperative task for bears is to break through this range and overlap yesterday's bullish momentum with an update to the low of 1.1469, where I recommend taking profits, since there are also moving averages that limit the downward potential. In case of further growth in the absence of fundamental statistics and negative news on the eurozone, I advise you to defer short positions to update the high of 1.1605 or sell EUR/USD immediately on a rebound from resistance at 1.1648, based on a correction of 25-30 points within the day.
Indicator signals:
Moving averages
Trading is conducted above 30 and 50 moving averages, which indicates the likelihood of a further bull market.
Note: the period and prices of moving averages are considered by the author on the hourly chart H1 and differ from the general definition of the classic daily moving averages on the daily chart D1.
Bollinger Bands
Growth will be limited by the upper level of the indicator around 1.1585. In case the pair declines, support will be provided by the average border in the area of 1.1508, and you can buy euros immediately on the rebound from the lower border of the indicator in the area of 1.1427.
Description of indicators
- Moving average (moving average, determines the current trend by smoothing out volatility and noise). Period 50. It is marked in yellow on the chart.
- Moving average (moving average, determines the current trend by smoothing out volatility and noise). Period 30. It is marked in green on the chart.
- MACD indicator (Moving Average Convergence/Divergence — convergence/divergence of moving averages) Fast EMA period 12. Slow EMA period to 26. SMA period 9
- Bollinger Bands (Bollinger Bands). Period 20
- Non-commercial traders are speculators, such as individual traders, hedge funds, and large institutions that use the futures market for speculative purposes and meet certain requirements.
- Long non-commercial positions represent the total long open position of non-commercial traders.
- Short non-commercial positions represent the total short open position of non-commercial traders.
- The total non-commercial net position is the difference between short and long positions of non-commercial traders.