
From the point of view of complex analysis, you can see a strong downward movement, meaning that our forecasts coincided, let's talk about the details.
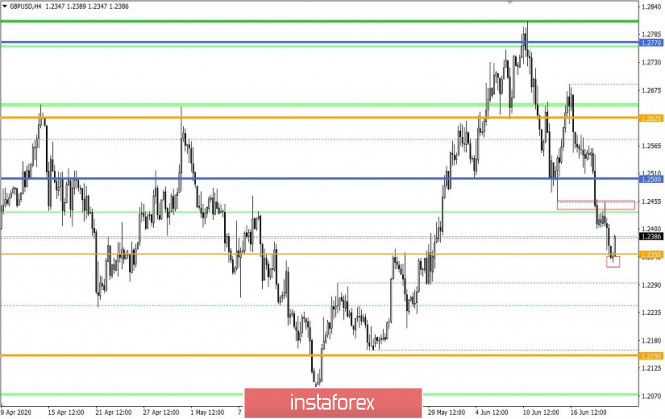
Last trading week managed to not only consolidate the success of the correctional move from the range level of 1.2770, but also return the market participants to the previous range of fluctuations of 1.2150 // 1.2350 // 1.2620. This turn has destroyed the dreams of followers of upward development, because the transition to a new range of fluctuations [1.2150//1.2350//1.2620 ---> 1.2770//1.3000//1.3300] postponed indefinitely.
Before a detailed analysis of the Friday trading day, you should pay attention to the dynamics and inertial activity of the last three weeks. We mentioned earlier in reviews that the intensity of the current movement is directly related to speculative activity, and this is a signal of instability, and it can lead to a rapid change in market sentiment. The upward inertial move of May 26 already indicated speculative activity, where after reaching the range of 1.2770, we presented the theory of a possible reversal, which arose on the market later. The speculative mood, without undue labor, changed the direction where our tactics of local operations were at their best again, having an impressive profit on a trade deposit.
Let's return to Friday's trading day, which shows that the variable stagnation in the area of 1.2400/1.1450 was broken in a downward direction, where market participants managed to regroup trading forces. And as a result, price consolidation was obtained below the average level of 1.2350 for a four-hour period, which is a good signal for further progress.
Regarding the theory of market development, the emphasis is still on speculative activity, which returned the quote to its original range [1.2150 // 1.2350 // 1.2620], but leaving a mention that everything can change quickly. In any case, our task is local operations, and if the hype has a downward slope, then there is still a chance of decline to the border of 1.2150.
In terms of volatility, dynamics is consolidated just below the average daily norm [-11%], but an activity indicator above 100 points automatically assigns the status of speculative excitement and is beneficial for volatility.
As discussed in the previous review, traders expected a further downward move in case the price consolidates below 1.2400, thus the position at the ready.
The trading recommendation from Friday regarding short positions coincided 100%, having an increase in the trade deposit.
[Sell positions are considered if the price consolidates below 1.2400, with the prospect of a move to 1.2350.]
Considering the trading chart in general terms (the daily period), it is worth noting that the most similar development of the range level of 1.2770 was on June 25, 2019, where a downward spiral appeared, which led the quote to a psychological value of 1.2000. The existing movement has a rate of change of course almost twice as high, and overheating of short positions may come soon. Based on the laws of the past, the average level of 1.2350 could perfectly play the role of regrouping trade forces.
The news background on Friday had data on retail sales in Britain, which managed to surprise investors. So, the data for May showed sales growth of 12% with a forecast of 5.7%, but such positive statistical data is most likely associated with a gradual weakening of quarantine measures in this period. In annual terms, retail sales continue to be in the negative zone of -13.1%.
The pound sterling was not helped by the revival of retail sales, it continued to decline.
In terms of the general informational background, we are increasingly seeing bad signals from the UK economy, which was going through hard times even before the coronavirus pandemic, and with quarantine measures, it even began to bend. According to the National Statistical Office [ONS], the UK public debt has exceeded GDP for the first time in half a century. The amount of debt in May reached 1.9 trillion pounds, which means that it grew by 173.2 billion pounds for the year.
At the same time, no one has forgotten about the Brexit divorce process, which, although it has moved from the dead point, is still in the balance and causes fear for investors, who, according to statistics, have all fled to the Netherlands.
Today, in terms of the economic calendar, we only have data on sales in the secondary housing market of the United States for May, where a decline of -3.0% is expected, but there is a significant improvement compared to the period before.

Further development
Analyzing the current trading chart, we can partially see the recovery from the inertial course of the past week, where the quote rebounds from the average level of 1.2350. In fact, this may be a regrouping of trading forces, during which profit is fixed from short positions and thereby the risks for the subsequent movement are balanced.
In terms of the emotional mood of the market, you can see that the speculative mood is still on the wave, which means that volatility will continue to be at a high level.
It can be assumed that during the regrouping of trading forces, the quote will be able to return to the area of 1.2450, but traders will not complete the downward development strategy. If the price consolidates below the level of 1.2330, the downward movement will resume towards the lower boundary of the variable range 1.2150 // 1.2350 // 1.2620.
At the same time, if the process of regrouping trade forces is delayed, then we can see the time amplitude within the range of 1.2350 / 1.2500.
Based on the above information, we derive trading recommendations:
- Consider buy deals in the direction of 1.2450.
- Consider sell deals in case of price consolidation below the level of 1.2330, with the prospect of a movement to 1.2250-1.2150.
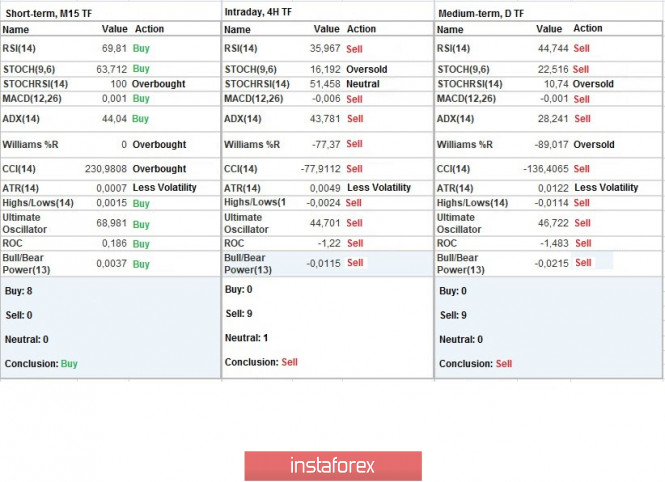
Indicator analysis
Analyzing a different sector of time frames (TF), we see that the indicators of technical instruments on hourly and daily periods signal a sale due to the rapid downward trend of the past week. Minute intervals signal a purchase due to the process of rebound from the average level.
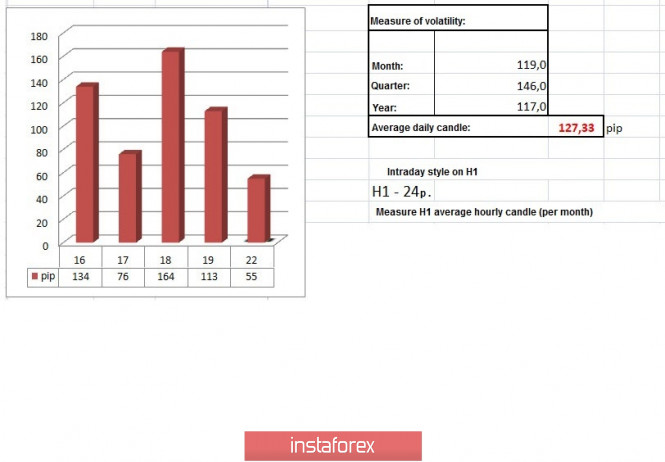
Volatility per week / Measurement of volatility: Month; Quarter; Year
Measurement of volatility reflects the average daily fluctuation, calculated for the Month / Quarter / Year.
(June 22 was built taking into account the time of publication of the article)
The volatility of the current time is 55 points, which is still within normal limits for the start of trading. It can be assumed that as Europeans enter the market, acceleration will occur, which will lead to a further increase in volatility.
Key levels
Resistance Zones: 1.2500; 1.2620; 1.2770 **; 1.2885 *; 1.3000; 1.3170 **; 1.3300 **; 1.3600; 1.3850; 1.4000 ***; 1.4350 **.
Support Zones: 1.2350 **; 1.2250; 1.2150 **; 1.2000 *** (1.1957); 1.1850; 1.1660; 1.1450 (1.1411); 1.1300; 1.1000; 1.0800; 1.0500; 1.0000.
* Periodic level
** Range Level
*** Psychological level
**** The article is built on the principle of conducting a transaction, with daily adjustment
The material has been provided by InstaForex Company - www.instaforex.com