
The EUR/USD pair failed to attempt to break up once again the resistance line 1.1375 (red bold line) last week and after that, the price declined. Moving down, the price tested the pullback level of 23.6% - 1.1236 (red dashed line). The price may continue to decline for the coming week.
Trend analysis.
This week, the price from the level of 1.1254 (closing of the last weekly candle) can continue to decline with the first target of 1.1121 - pullback level of 38.2% (red dashed line). From which, two possible scenarios can be considered.
- The price will continue to decline to the next lower target of 1.1028 - a pullback level of 50.0% (red dashed line), if the level of 1.1121 is broken down.
- It is likely that the price will start to increase with the target of 1.1362 - the resistance line (red bold line) with the rebound from the level of 1.1121.
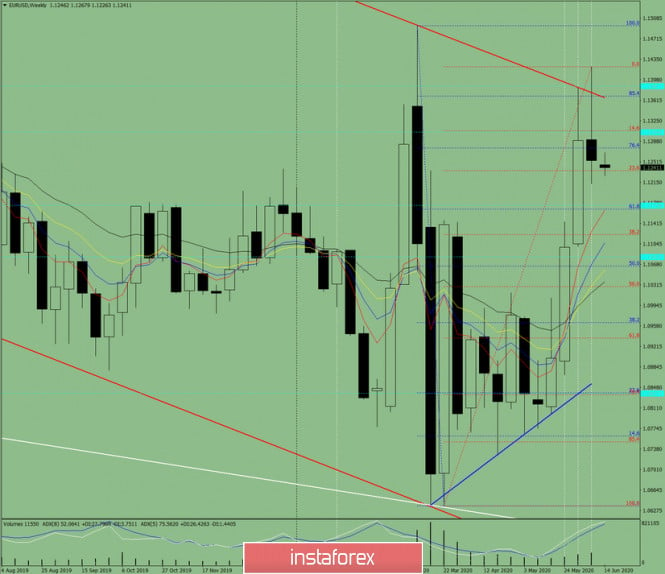
Fig. 1 (weekly schedule).
Comprehensive analysis:
- indicator analysis - down;
- Fibonacci levels - down;
- volumes - down;
- candlestick analysis - down;
- trend analysis - down;
- Bollinger Lines - down;
- monthly chart - up.
The conclusion of a comprehensive analysis is a downward movement.
The overall result of calculating the candle of the EUR/USD currency pair according to the weekly chart: the price of the week is likely to have a downward trend with the absence of an upper shadow for the weekly black candlestick (Monday - down) and the presence of a second lower shadow (Friday - up).
The first lower target of 1.1121 is the pullback level of 38.2% (red dashed line).
There are two possible scenarios.
The material has been provided by InstaForex Company - www.instaforex.com