
To open long positions on EUR/USD, you need:
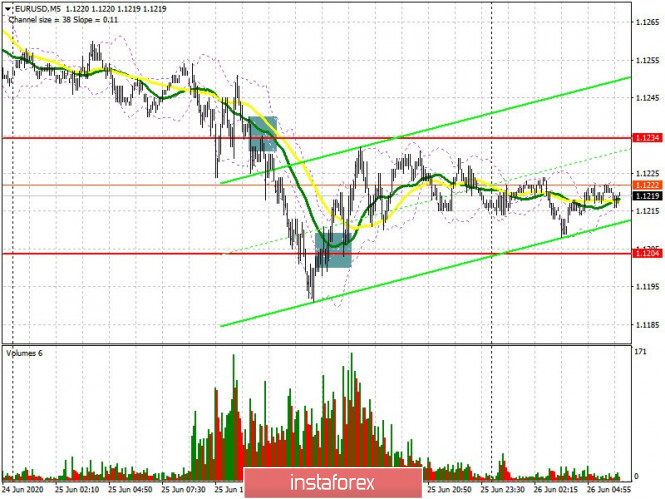
Yesterday, the report of the European Central Bank and forecasts of economists did not greatly please the market, as well as the fact that the number of initial applications for unemployment benefits in the United States stopped declining, indicating the possibility of a backward wave of growth amid the risks associated with the second outbreak of the coronavirus pandemic. If you look at the 5-minute chart, you will see how the sellers formed an excellent signal to sell the euro at 1.1234 closer to the afternoon, I drew attention to it in my review for the US session, and continued to push the euro. And by the middle of the trading, the bulls managed to form a false breakout at the level of 1.1204, which was a signal to open long positions. As a result, the pair stayed in the side channel of 1.1200-1.1234. As for the current technical picture of the EUR/USD pair, a break and consolidation above resistance 1.1234 is a priority for euro buyers, which will help them save the situation from forming a new bear market. Breakthrough of 1.1234 will provide the bulls with an impulse that can return EUR/USD to a high of 1.1280, where I recommend taking profits. Buyers of the euro should also protect the support of 1.1200, where the lower border of the current rising channel formed at the beginning of this week. Forming a false breakout there will be a signal to open long positions. In the absence of bull activity at this level, it is best to postpone purchases until the weekly low is updated in the region of 1.1170, based on a correction of 20-25 points within the day. It is also necessary to remember the COT reports, which clearly indicate the preservation of the bullish momentum in the market. Any decline in the euro will make the market more suitable for purchases by institutional investors. During the reporting week, a short non-commercial position was reduced from the level of 89,020 to the level of 69,988, while long non-commercial positions sharply rose from the level of 184,669 to the level of 187,120. As a result, the positive non-commercial net position increased again and reached 117,132, against 95,639, which indicates a growing interest in buying risky assets even at current prices high enough for the market.
To open short positions on EUR/USD, you need:
Euro sellers keep the market under their control and all they need to do in the first half of the day is to achieve a false break out in the resistance area of 1.1234, where the moving averages are also located, it will not be so easy to go outside. In this scenario, you can count on a second return and a support test of 1.1200, consolidating below this level will be an additional signal to sell the euro in the area of the week's low at 1.1170, where I recommend taking profits. The speech of the European Central Bank President Christine Lagarde could be the reason for such sales at the end of the week. If there is no activity on the part of the bears at 1.1234 in the first half of the day, and the bulls regain this range, it is best to postpone selling EUR/USD until the high of 1.1280 is updated, counting on a correction of 25-30 points within the day.
Signals of indicators:
Moving averages
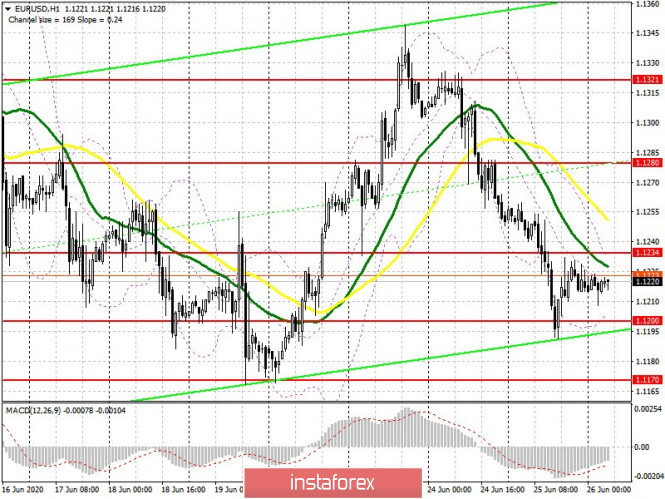
Trade is conducted below 30 and 50 moving averages, which indicates continued pressure on the euro.
Note: The period and prices of moving averages are considered by the author on the hourly chart H1 and differs from the general definition of the classic daily moving averages on the daily chart D1.
Bollinger bands
A break of the lower border of the indicator in the region of 1.1205 will increase pressure on the euro. You can count on upward correction only after a breakout of the upper boundary of the indicator in the region of 1.1234.
Description of indicators
- Moving average (moving average determines the current trend by smoothing out volatility and noise). Period 50. The graph is marked in yellow.
- Moving average (moving average determines the current trend by smoothing out volatility and noise). Period 30. The graph is marked in green.
- MACD indicator (Moving Average Convergence / Divergence - convergence / divergence of moving averages) Fast EMA period 12. Slow EMA period 26. SMA period 9
- Bollinger Bands (Bollinger Bands). Period 20
- Non-commercial traders are speculators, such as individual traders, hedge funds and large institutions that use the futures market for speculative purposes and meet certain requirements.
- Long non-commercial positions represent the total long open position of nonprofit traders.
- Short non-commercial positions represent the total short open position of nonprofit traders.
- The total non-commercial net position is the difference between short and long positions of non-profit traders.