
Trend analysis (Fig. 1).
Before the news today, the market may begin to move down from the upper fractal 1.1241 (red dashed line) with the target 1.1181, a retracement level of 14.6% (blue dashed line). Much will depend on the news. When the news is released, as per forecast, from the pullback level of 14.6% equivalent to 1.1181 (red dotted line), it is possible to move up.
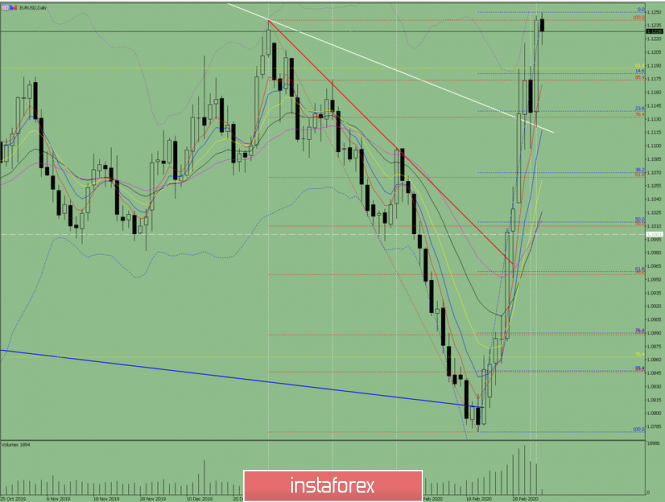
Fig. 1 (daily chart).
Comprehensive analysis:
- Indicator analysis - down;
- Fibonacci levels - down;
- Volumes - down;
- Candlestick analysis - down;
- Trend analysis - down;
- Bollinger lines - down;
- Weekly schedule - down.
General conclusion:
Today, from the upper fractal 1.1241 (red dashed line) the price may start moving down with the target 1.1181, a pullback level of 14.6% (blue dashed line).
An unlikely scenario is from a retracement level of 14.6% equivalent to 1.1181 (blue dashed line), work down with a target of 1.1139, a retracement level of 23.6% (blue dashed line).
The material has been provided by InstaForex Company - www.instaforex.com