
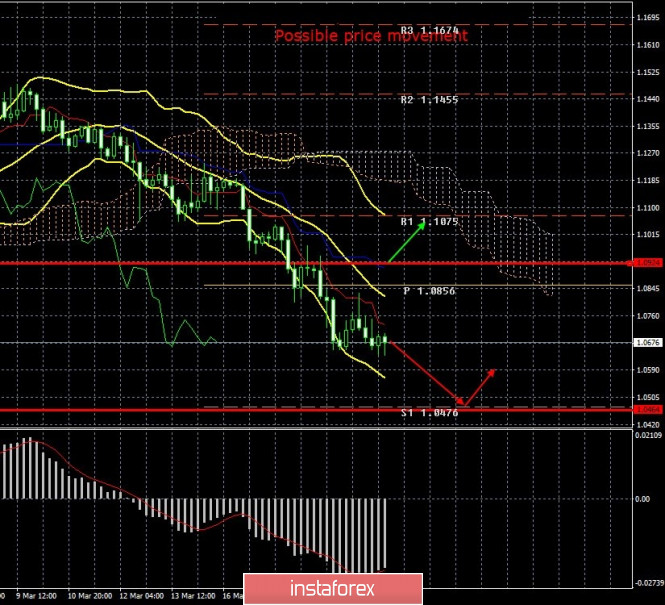
4-hour timeframe
The first trading day of the week for the currency pairs EUR/USD and GBP/USD will be boring in macroeconomic terms. At least this is what the calendar of economic events says. However, in times of an epidemic, when much of the forex currency market depends on the state of the commodity market and the US stock market, you can and should expect anything. There might be a new speech by the top officials of the United States or the EU. These could be new claims about the spread of the coronavirus or progress in the development and testing of a vaccine. Anything can throw traders into an even greater state of panic or, conversely, calm them down. If there are no high-profile events on Monday, March 23, in the world, then this day can be used as a catalyst for what is happening in the market. If European currencies do not slump, then we can really count on the fact that the bears are satisfied and have calmed down, and now the euro and the pound will not fall, conquering records of volatility. If the fall in the euro and pound quotes continues, then most likely, all the macroeconomic statistics of this week will be ignored. We are still counting on the first option. If it comes true, we will have a very interesting day on Tuesday, when traders can finally work out the macroeconomic reports from the UK, EU, Germany and the US. We believe that these reports will play the most significant role for traders this week.
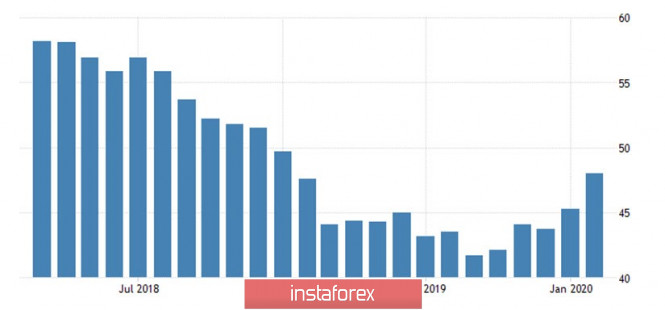
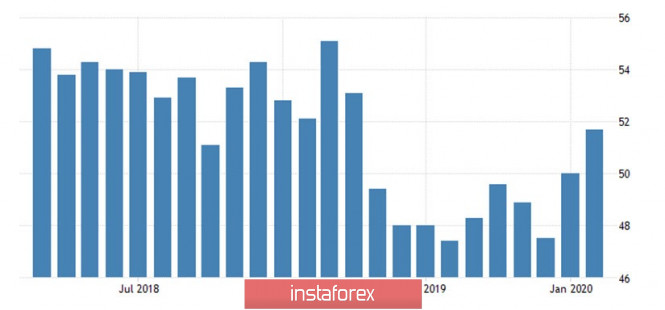
The first indexes of business activity in the German manufacturing and services sectors will be published. The latest index value for the manufacturing sector was 48 and showed signs of recovery. According to experts, in March, the value of business activity will fluctuate between 38.5 and 40.0 points.
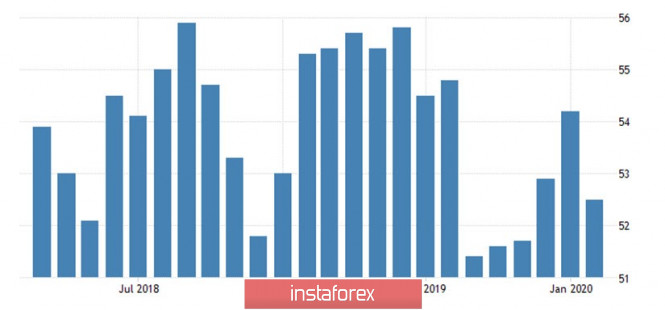
Everything will be the same for the service sector. From a value of 52.5, which means the growth of the industry, the business activity index should fall to 37.8-42.0, which will mean a sharp decline. Although the forecasts are extremely low, we believe that the real numbers could be even worse. It won't make much difference, though. With almost 100% probability, business activity in Germany will go below the waterline..
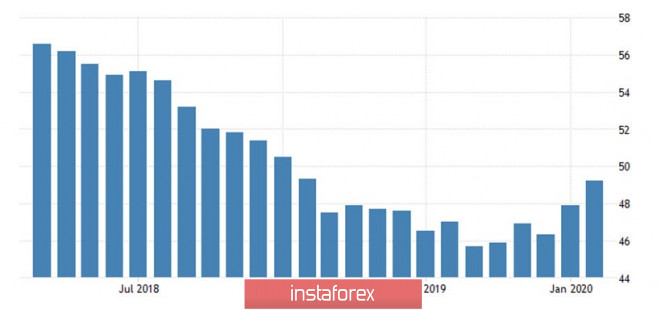
Things will not be any better in the European Union as a whole. The index of business activity for the industrial sector in February was 49.2 and has recovered after falling to 46.0. However, economists expect a new fall , this time even lower, in the area of 39.0 – 39.6.
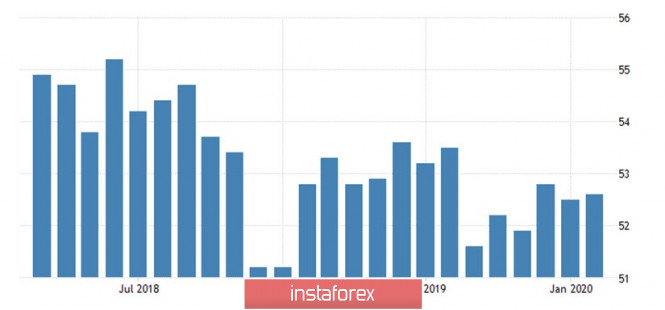
The same is expected for the business activity index for the services sector, which may decrease from the current 52.6 to 37.5-38.1.
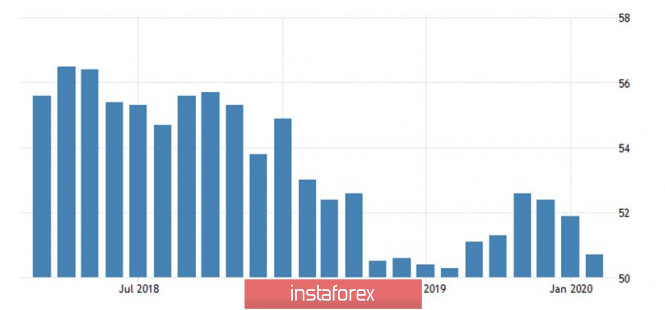
In the UK, which is still formally part of the European Union, business activity in the industry may not fall as much, only to 45.0.
Business activity in the service sector will decrease to 44.0 – 45.0 from February's 53.2. Thus, all six European business activity indices will almost completely move to the area below the 50.0 mark, which will mean a serious decline in the designated areas of the designated countries. In principle, we do not see anything surprising in this, given the quarantines associated with the epidemic. In the coming weeks, we will regularly receive data for the month of March, which at best will disappoint investors and traders, and at worst will shock them, causing a new panic in the currency market. We believe that the main question is how strong will the cuts in the macroeconomic indicators of the EU countries and the United States be?
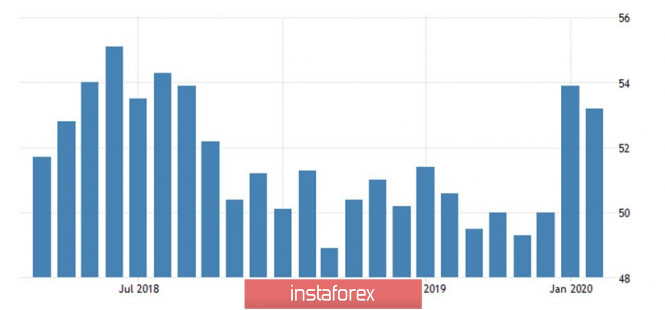
Business activity will also be published in the US. The production sector is expected to decrease from 50.7 to 42.0-43.0.
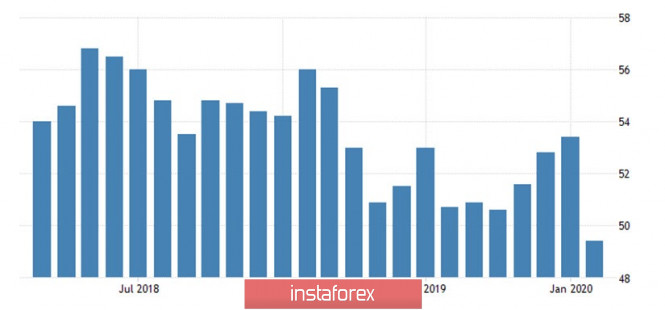
The service sector from 49.4 to 40.0-42.0. However, we remind you that the United States also publishes business activity indices according to the ISM version, which are considered more important and significant. However, in our case, this does not play any role, since, most likely, they will also go below the level of 50.0.
Thus, all the macroeconomic statistics for March are likely to be completely failed. The only question is, which will fail the most, where will the stronger decline be recorded?
4-hour timeframe
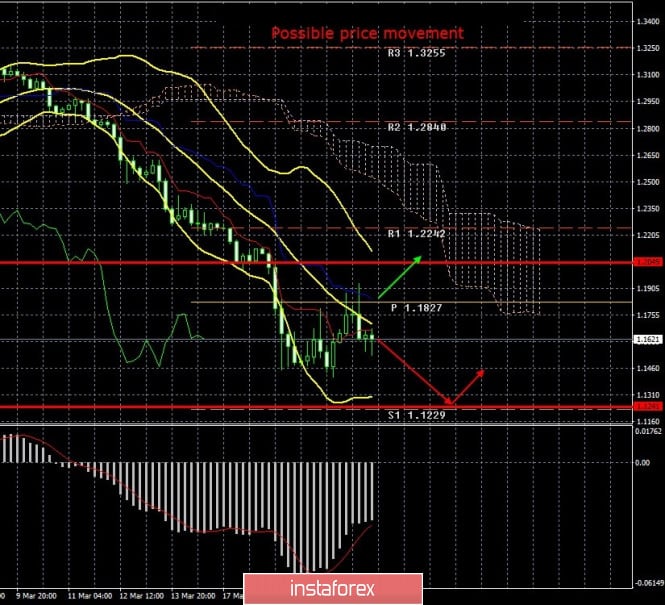
The pound sterling is ready to resume the downward movement, as it rebounded from the critical Kijun-sen line. On Monday, we will need to understand whether traders are ready to refine macroeconomic statistics or whether chaotic and uncontrolled movement will continue.
Recommendations for short positions:
A strong downward movement remains in perspective in the EUR/USD currency pair. According to the Ichimoku indicator, it is recommended to resume pulling down trade with the goal of the first support level of 1.1229, until signs of a new round of correctional movement appear.
Recommendations for long positions:
Euro currency purchases with the goal of the Senkou Span B line can be considered no earlier than when the pair consolidates above the Kijun-sen line. However, in any case, it is recommended to be as careful as possible with the opening of any positions. Panic in all markets is still present.
Explanation of the illustration:
Ichimoku indicator:
Tenkan-sen is the red line.
Kijun-sen is the blue line.
Senkou Span A - light brown dotted line.
Senkou Span B - light purple dashed line.
Chikou Span - green line.
Bollinger Bands Indicator:
3 yellow lines.
MACD indicator:
Red line and bar graph with white bars in the indicators window.
Support / Resistance Classic Levels:
Red and gray dashed lines with price symbols.
Pivot Level:
Yellow solid line.
Volatility Support / Resistance Levels:
Gray dotted lines without price designations.
Possible price movements:
Red and green arrows.
The material has been provided by InstaForex Company - www.instaforex.com