
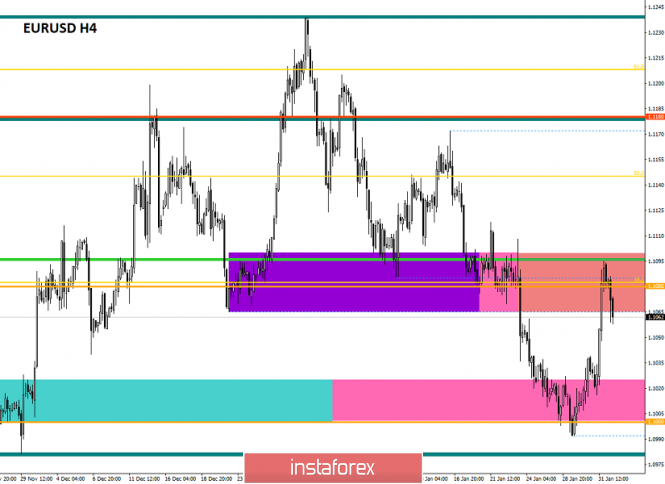
From the point of view of complex analysis, we see the long-awaited breakdown of a variable range of 1.0980 / 1.1040,which has slowly developed along the psychological level of 1,1000 for almost the entire past week. So the acceleration came that very day, which many were waiting for, where as a result the quote returned to the recently passed level of 1.1080 again, which means that the psychological level has resisted once again. What we traders got from this is a quick profit without any difficulties, and what we are faced with is further delaying an elongated correction. Let me remind you that the recent rapprochement with the psychological level of 1.1000 raised a lot of discussion regarding the recovery process, relying on the fact that behind was support for the downward movement since early January, as well as the fact that the correction process has been delayed for four months. The result is a repetition of November 2019, where the level of 1.1000 has stood, and the restoration of the elongated correction was postponed for months. Is it worth it to remove the recovery theory, I don't think, because the global downward trend has not yet undergone dramatic changes, and the price is still at the first stage of the recovery process.
In terms of volatility, we see a local acceleration after a four-day stagnation, where the Friday figure is 75% higher than the average daily.
Analyzing minute by minute on Friday, we see that the main round of acceleration occurred in the period 10:45 -15:00 [UTC+00 time on the trading terminal]. After that, there was a slight decrease in activity and updating daily highs.
As discussed in the previous review, traders have been stubbornly waiting for acceleration almost from the beginning of the week, carefully analyzing the coordinates of 1.0980 and 1.1040. The hour "X" has arrived, the price breaks the level of 1.1040 and we get deals almost at the beginning of the move, which were held up to the level of 1.1080. Moreover, subsequent actions were in terms of recovery points.
Considering the trading chart in general terms [the daily period], we see the process of fluctuation inside the oblong correction, where an assumption of a possible flat formation appeared, taking into account the sixth development of the psychological level of 1.1000.
On the other hand, Friday's news background contained inflation data in Europe, where the forecasts coincided and we saw accelerations from 1.3% to 1.4%. In fact, a moderate increase in inflation reduces the fear of a possible reduction in the ECB interest rate. After that, preliminary data on EU GDP came out, where expectations coincided in the form of economic growth rates from 1.2% to 1.0%. However, there was no market reaction at first, but the market turned around after a few hours and, most likely, against the background of a general weakening dollar.
In terms of general informational background, we have a conditional finish of the Brexit divorce proceedings, where negotiations on trade relations have not yet arrived, and the fear of the lack of agreement is already at its limit. Thus, the Prime Minister of Great Britain will not make concessions on issues related to standards and rules in the field of competition, subsidies and social protection during the upcoming March negotiations, since the British rules are more perfect. Naturally, the European Union does not like this and today we received a response from the European Union's chief negotiator for Brexit, Michel Barnier, who insists that a very ambitious trade deal will only be possible if Boris Johnson signs strict rules to prevent unscrupulous competition. Generally, such an unstable background hits the exchange rates, pound sterling and in a single currency.
Today, in terms of the economic calendar, we have already received data on the Eurozone PMI, where acceleration in the manufacturing sector from 46.3 to 47.9 was recorded. In the afternoon, similar data on PMI but for the United States, was released, where a slowdown is predicted.
Further development
Analyzing the current trading chart, we see a pullback from the level of 1.1080, where the quote locally went down to 1.1055, but there have not yet been any fixations in this area. In fact, the fluctuation is still conducted within the level of 1.1080 [1.1060 / 1.1100], but the potential for reduction remains. There is an assumption that there is a kind of correlation from the GBP/USD pair , where in a similar period of time a cutting down was recorded just against the backdrop of a statement by Michel Barnier.
In terms of the emotional mood of market participants, we have a continuing speculative interest, which was set last Friday.
In turn, traders are trying to work on the rebound, but significant trading volumes have not yet been recorded. Thus, fixing the price lower than 1.1060-1.1055 relative to the H4 time frame is needed.
It is likely to assume that an ambiguous mood with local bursts of activity will still remain in the market, where at first we consider the range 1.1060 / 1.1100 as a temporary platform. After clear fixations outside the given framework, actions are already being taken. Regarding the trading approach, this time interval is more suitable for speculators, since we are talking about time fluctuations.
Based on the above information, we derive trading recommendations:
- Buy positions will be considered in case of breakdown of accumulation and fixing prices higher than 1.1100.
- Sell positions will be considered in case of price fixing lower than 1.1060-1.1055.
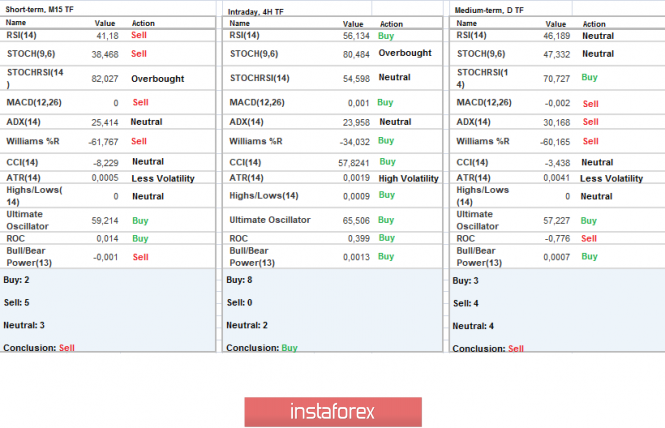
Indicator analysis
Analyzing a different sector of timeframes (TF), we see multi-directional interest with respect to all time intervals, where the minute sections signal a sale, the hourly ones about a purchase, and the daytime ones about a sale. So, let's pay attention to the technical indicators that are actually in the neutral zone.
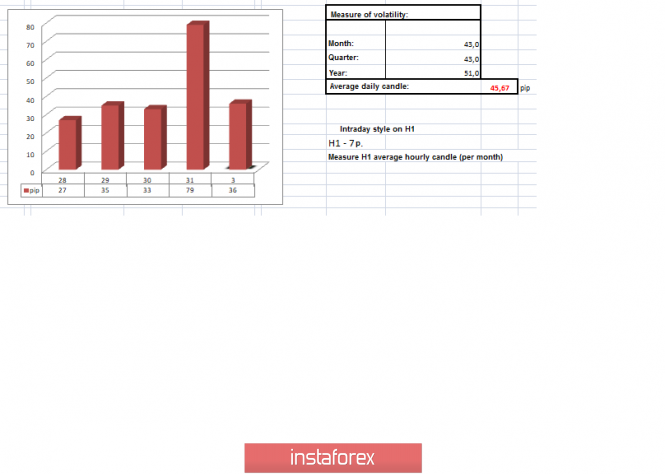
Volatility per week / Measurement of volatility: Month; Quarter; Year
Measurement of volatility reflects the average daily fluctuation calculated for Month / Quarter / Year.
(February 3 was built taking into account the time of publication of the article)
The volatility of the current time is 36 points, which is already close to the daily average. It is likely to assume that if the price is kept near the range of 1.1080, the volatility of the day will remain at the same limits as now, but if the borders fall, we can expect another acceleration.
Key levels
Resistance zones: 1.1080 **; 1.1180; 1.1300 **; 1.1450; 1.1550; 1.1650 *; 1.1720 **; 1.1850 **; 1.2100
Support Areas: 1.1000 ***; 1.0900 / 1.0950 **; 1.0850 **; 1,0500 ***; 1.0350 **; 1.0000 ***.
* Periodic level
** Range Level
*** Psychological level
***** The article is built on the principle of conducting a transaction, with daily adjustment
The material has been provided by InstaForex Company - www.instaforex.com