
4-hour timeframe
Amplitude of the last 5 days (high-low): 74p - 43p - 126p - 62p - 56p.
Average volatility over the past 5 days: 73p (average).
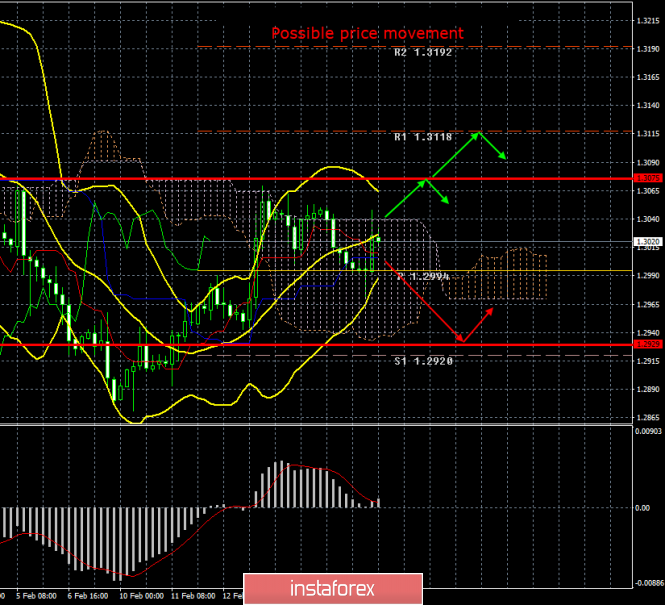
Tuesday, February 18, was held in completely illogical and versatile bidding for the British pound. One gets the impression that traders are completely unaware of which direction they need to trade in now. The GBP/USD currency pair continues to be traded inside the Ichimoku cloud, today it once again worked out its upper border, the Senkou Span B line, bounced off it again and now again tries to resume its downward movement. At the same time, a weak buy signal from Ichimoku Golden Cross remains. Bollinger Bands began to narrow, indicating the completion of the upward movement. In the current situation, it is not recommended to trade for increase or decrease in usual volumes.
We have repeatedly said that the British pound has no reason to strengthen. That is, the absolutely reasonable movement would now be a downward movement. However, for some reason the bears do not want to start selling, so the current situation is very similar to the euro's situation, which we deemed paradoxical. Recall that this is a situation in which the bears have all the necessary fundamental factors for selling, but do not want to carry them out, and the bulls do not have any macroeconomic basis for purchases, therefore they are content to open only short-term positions that a priori cannot help form an upward trend. If you look at the 24-hour timeframe, the whole picture of the currency pair now looks like a classic "swing". Trend movement is completely absent, but the downward trend still persists.
A new portion of fundamental information has arrived from the UK today, February 18. It is easy to guess that most of it was again disappointing. In the morning article, we listed all the macroeconomic reports that are worth paying attention to. Now we analyze them. The least interesting unemployment rate was 3.8% at the end of December, as analysts expected. More interesting data on the number of applications for unemployment benefits during January showed 5,500 instead of the expected 22,600. Thus, this report can be regarded as positive for the British currency. However, the positive news ends here. The average salary including bonuses in December showed an increase of only 2.9% against the previous value of +3.2% and the forecast of +3.0%. The average salary, excluding bonuses, showed an increase of 3.2% against the forecast of +3.3% and the previous value of +3.4%. Thus, the most important indicator, from our point of view, turned out to be worse than the expectations of traders. Thus, the whole news package from the UK can not be called uniquely disastrous, but it could not support the British pound. The British currency particularly increased in the afternoon, when the data was published, but it was short-lived and the next 4-hour candle turned out to be bearish.
Meanwhile, the representative of the UK in negotiations with the EU, David Frost, said that "if the EU wants to build strong and long-term relations with the British, then the only possible way out is to build them on the basis of mutual equality." Frost also notes that London will not accept the terms of cooperation with the EU on the terms proposed by Brussels. In other words, London refuses the EU conditions on fair competition between European and British companies, on conditions related to state subsidies. "How would you feel if Britain demanded that the EU begin to quickly adapt its laws to those established in Westminster to protect its interests?", asks David Frost. Thus, as we said earlier, negotiations between the parties have not even begun, and there are already so many disagreements that it may take 11 years instead of 11 months to resolve them. This whole situation significantly reduces the likelihood of reaching an agreement, but increases the likelihood that Britain will leave the EU at the end of 2020 without any deals. Boris Johnson cannot understand the situation, nor can he understand the consequences for the British economy from the lack of a deal, however, in this situation, he will have to sacrifice something. Either drive the UK economy into an open recession, or agree to the tough influence of the European Union on many areas.
From a technical point of view, the pound can move from any current position in almost any direction. The fact that the British currency failed with three attempts to cross the Senkou Span B line leaves a good chance of resuming a downward movement.
Trading recommendations:
GBP/USD continues to adjust. Thus, it will be possible to sell the British pound with the target of 1.2929 only after the price consolidates below the critical line and only in small lots, since the price is still inside the cloud. We recommend considering the pair's purchases with the objectives of 1.3075 and 1.3118, if the Ichimoku cloud is nevertheless overcome, but it should be understood that the fundamental factors do not remain on the side of the British currency.
Explanation of the illustration:
Ichimoku indicator:
Tenkan-sen is the red line.
Kijun-sen is the blue line.
Senkou Span A - light brown dotted line.
Senkou Span B - light purple dashed line.
Chikou Span - green line.
Bollinger Bands Indicator:
3 yellow lines.
MACD indicator:
Red line and bar graph with white bars in the indicators window.
Support / Resistance Classic Levels:
Red and gray dashed lines with price symbols.
Pivot Level:
Yellow solid line.
Volatility Support / Resistance Levels:
Gray dotted lines without price designations.
Possible price movements:
Red and green arrows.
The material has been provided by InstaForex Company - www.instaforex.com