
4-hour timeframe
Amplitude of the last 5 days (high-low): 34p - 60p - 55p - 33p - 22p.
Average volatility over the past 5 days: 41p (average).
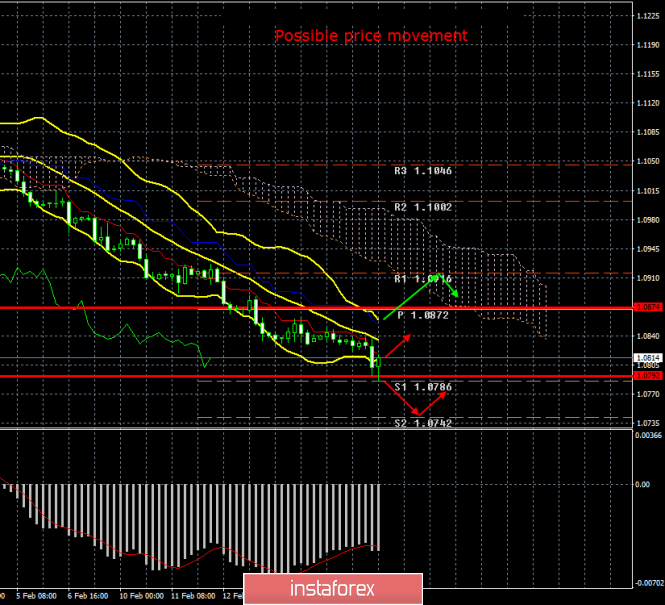
The EUR/USD currency pair continued its downward movement on Tuesday, February 18, and by the end of the day it worked both the first support level for this week at 1.0786 as well as the lower boundary of the volatility channel, and it once again updated three-year lows at the same time. In fact, each new decline down to the level of 1.0339 will be accompanied by an update of three-year lows. The essence is different, the euro is now extremely weak, the EU economy, although it is keeping afloat, does not show any signs of recovery, therefore the most important thing is the absence of factors due to which one could hope for a recovery and growth of the European currency. It should also be noted that over the past 16 days no correction or even a hint of it has happened. As often happens, similar in strength trend movements begin on a flat ground. After all, nothing preceded such a confident fall in the euro. Neither the ECB meeting, nor the Fed meeting, nor the statement by the heads of central banks, nothing. The downward movement simply started against the backdrop of weak macroeconomic statistics from the EU and strong from the US (which, incidentally, was observed long before the start of the movement) and has been going on for the 16th consecutive day. Moreover, it persists even in those days when there are no macroeconomic factors to continue it. For example, yesterday or today. Not a single significant report was published at all yesterday, February 17 - the euro/dollar stayed near its lows all day, fearing it would "detach" from them. Several minor reports were published today - the euro has resumed its decline. What does this fall can not even be called strong. The average volatility of the pair is still 40-50 points per day, no more, and it has also decreased in recent days.
As for macroeconomic statistics that were published today, the first three came from the ZEW Institute and reflected economic sentiment indices in Germany and the European Union, as well as an assessment of current economic conditions. In today's morning article, we were surprised at the fact that the economic sentiment indices in the last five months showed not a slight increase and literally resurrected. We wondered why investors are optimistic if the economy of Germany and the EU continues to slow down? It turned out that we were asking similar questions not in vain, because today's data showed a sharp decline in all three indices. The mood index in the business environment of Germany fell from 26.7 points to 8.7, a similar index in the EU - from 25.6 to 10.4, despite the fact that forecasts predicted growth to 30.0 points. And the index for assessing current economic conditions in Germany fell from -9.5 to -15.7. It is unlikely that these indices caused the next fall of the European currency, however, one cannot but admit that these data could further strengthen the negative attitude of traders towards the euro.
A much more objective reason for the fall is the deceleration of the German economy (the locomotive country of the European Union), as well as the entire EU. Recall that, according to the latest data, German GDP slowed down to 0.4% in annual terms, and European GDP - to 0.9% yoy. Moreover, many world experts note that the Chinese coronavirus will affect not only the economy of China, but also all its trading partners, including the US, the EU, and Germany. The German economy is an export-oriented economy. If demand for its products decreases, problems begin that threaten to go into recession. However, it should be recognized that the situation with the coronavirus in China is still far from critical. According to the latest data, the number of deaths from the virus has reached about 2000, and the number of infected people does not exceed 70,000. It is clear that the real numbers are likely to be much higher, however, scientists also note that in fact the Covid-2019 virus is not so dangerous to humans, as previously thought. For example, other coronaviruses, SARS and Merce, are far more deadly. From the Chinese virus, no more than 20% of patients die as a result of complications, the rest are completely cured. Moreover, the virus causes pneumonia, that is, it spreads much better in the cold season than in the warm season. Doctors are already predicting that by the end of February, the growth rate of the incidence rate will decline.
From a technical point of view, nothing new can be noted. The euro/dollar pair has another chance to start a correctional movement, since there was a rebound from the level of 1.0786, but traders did not use such an enormous amount.
Trading recommendations:
The EUR/USD pair keeps the downward movement. Thus, it is now recommended that you stay in euro-currency sales with targets at support levels of 1.0786 and 1.0742. The MACD indicator may begin to discharge again. It will be possible to consider buying the euro/dollar pair in small lots with the goal of a first resistance level of 1.0916, if traders manage to gain a foothold above the Kijun-sen line.
Explanation of the illustration:
Ichimoku indicator:
Tenkan-sen is the red line.
Kijun-sen is the blue line.
Senkou Span A - light brown dotted line.
Senkou Span B - light purple dashed line.
Chikou Span - green line.
Bollinger Bands Indicator:
3 yellow lines.
MACD indicator:
Red line and bar graph with white bars in the indicators window.
Support / Resistance Classic Levels:
Red and gray dashed lines with price symbols.
Pivot Level:
Yellow solid line.
Volatility Support / Resistance Levels:
Gray dotted lines without price designations.
Possible price movements:
Red and green arrows.
The material has been provided by InstaForex Company - www.instaforex.com