
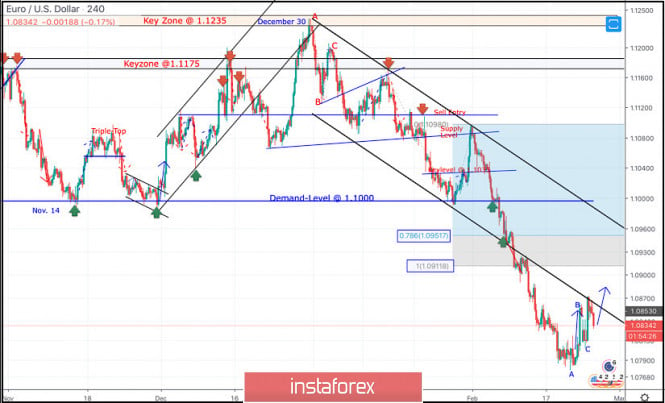
On December 30, a bearish ABC reversal pattern was initiated around 1.1235 (Previous Key-zone) just before another bearish movement could take place towards 1.1100 (In the meanwhile, the EURUSD pair was losing much of its bearish momentum).
One more bullish pullback was executed towards 1.1175 where the depicted key-zone as well as the recently-broken uptrend were located. That's why, quick bearish decline was executed towards 1.1100 then 1.1035 which failed to provide enough bullish SUPPORT for the EURUSD pair.
Further bearish decline took place towards 1.1000 where the pair looked quite oversold around the lower limit of the depicted bearish channel where significant bullish rejection was able to push the pair back towards the nearest SUPPLY levels around 1.1080-1.1100 (confluence of supply levels (including the upper limit of the channel).
Since then, the pair has been down-trending within the depicted bearish channel until last week when bearish decline went further below 1.0950 and 1.0910 (Fibonacci Expansion levels 78.6% and 100%) establishing a new low around 1.0790.
Currently, the EUR/USD pair looks quite oversold after such a long bearish decline and if bullish recovery is expressed above 1.0845-1.0860, further bullish advancement would be expected towards 1.0910 then 1.0950.
Intraday traders were advised to look for signs of bullish recovery around the price levels of (1.0790) as a valid intraday BUY signal aiming towards 1.0910 (the nearest broken demand-level).
By the end of Last week, recent signs of bullish recovery were manifested around 1.0790 leading to the current bullish movement.
Further bullish advancement will probably pursue as high as the price level of 1.0910 provided that a quick bullish breakout above 1.0870 is achieved.
On the other hand, bearish persistence below 1.0790 may enable more bearish decline towards new historical lows around 1.0755 and even 1.0700.
The material has been provided by InstaForex Company - www.instaforex.com