
Let us consider how the development of the movement of the dollar index #USDX, the currency of the "country of the rising sun" USD / JPY and its cross instruments - EUR / JPY and GBP / JPY will begin to flow from February 13, 2020.
Minuette (H4 time frame)
____________________
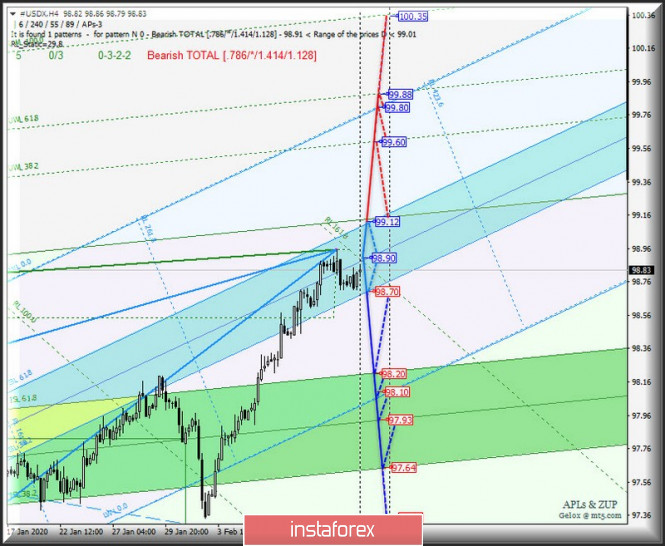
US dollar index
The development of the movement of the dollar index #USDX from February 13, 2020 will continue to be determined by development and the direction of breakdown of the boundaries of the equilibrium zone (98.70 - 98.90 - 99.12) of the Minuette operational scale forks. We look at the traffic markings inside this zone on the animated chart.
In case of breakdown of the lower boundary of the equilibrium zone ISL61.8 (support level of 98.70) of the Minuette operational scale forks, the development of the downward movement of the dollar index will be directed to the boundaries of the equilibrium zone (98.20 - 97.93 - 97.64) of the Minuette operational scale forks.
On the other hand, if the upper boundary of ISL61.8 (resistance level of 98.40) is broken, the equilibrium zone of the Minuette operational scale forks, the upward movement #USDX can be continued to the warning line UWL38.2 (99.60) of the Minuette operational scale forks and the final line FSL Minuette (99.80).
The marking options for the movement of #USDX from February 13, 2020 is shown on the animated chart.
____________________
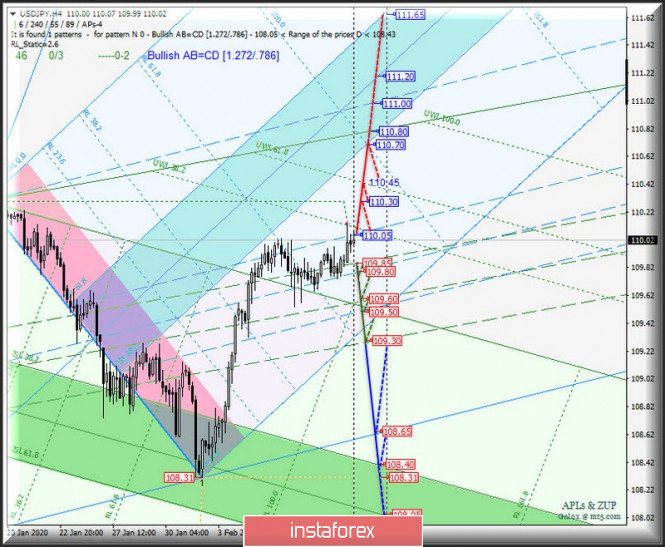
US dollar vs Japanese yen
The development of the USD / JPY currency movement of the "country of the rising sun" from February 13, 2020, just like before, will also be due to the development and direction of the breakdown range :
- resistance level of 110.05 (upper boundary of the 1/2 Median Line Minuette channel);
- support level of 109.85 (upper boundary of the 1/2 Median Line Minuette channel).
The breakdown of the support level of 109.85 and 1/2 of the Median Line Minuette (109.80) will determine the development of the USD / JPY movement in the 1/2 Median Line Minuette channel (109.85 - 109.60 - 109.30) with the prospect of reaching the LTL control line (108.65) of the Minuette operational scale forks and the upper boundaries of ISL38.2 (108.40) of the Minuette operational scale forks.
Alternatively, in case of breakdown of the upper boundary of the 1/2 Median Line Minuette channel (110.05), the upward movement of the currency of the "country of the rising sun" can be continued to the local maximum 110.30 and when updating, it will be possible to reach the warning line UWL61.8 (110.45) of the Minuette operational scale fork and the lower boundary ISL38.2 (110.70) of the Minuette operational scale forks.
We look at the details of the USD / JPY movement from February 13, 2020 on the animated chart.
____________________
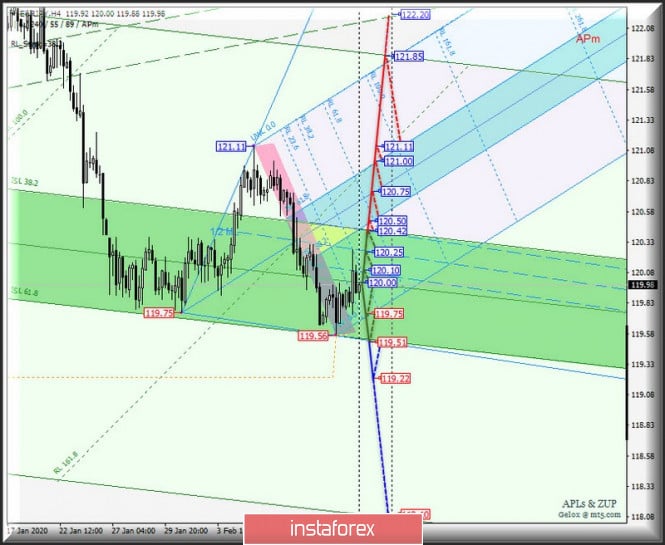
Euro vs Japanese yen
The development of the EUR / JPY cross-instrument movement from February 13, 2020 will be determined by the development and direction of the breakdown of the boundaries of the equilibrium zone (119.51 - 120.00 - 120.42) of the Minuette operational scale forks taking into account the development of the 1/2 Median Line channel (120.10 - 120.25 - 120.42) of the Minuette operational scale forks. The details of the development of the above levels are shown on the animated chart.
The breakdown of the upper boundary of the ISL38.2 (resistance level of 120.42) equilibrium zone of the Minuette operational scale forks will allow us to reach the boundaries of this cross-instrument of the equilibrium zone (120.50 - 120.75 - 121.00) of the Minuette operational scale forks, and in case of breakdown of ISL61.8 Minuette (121.00), the EUR / JPY movement can be continued to the local maximum 121.11 and the final line FSL Minuette (121.85).
On the contrary, if the support level of 119.51 is broken down at the lower boundary of the ISL61.8 equilibrium zone of the Minuette operational scale forks, the update of the local minimum 119.22 will become relevant.
The details of the movement of EUR / JPY, depending on the development of this range, are presented on the animated chart.
____________________
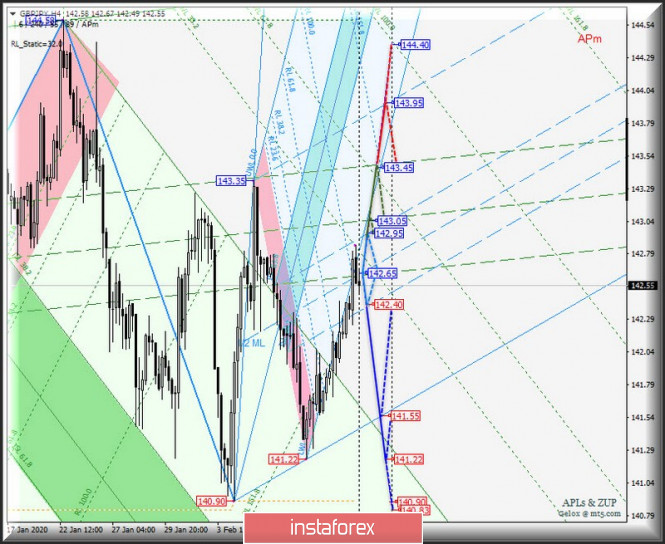
Great Britain pound vs Japanese yen
The development of the movement of GBP / JPY cross-instrument from February 13, 2020, as before, will continue to be determined by developing the boundaries of the 1/2 Median Line (142.40 - 142.65 - 142.95) of the Minuette operational scale forks. The details of the development mentioned levels are shown on the animated chart.
A sequential breakdown of the upper boundary of the 1/2 Median Line Minuette channel - resistance level of 143.20 and 1/2 Median Line Minuette (143.05) will determine the continuation of the upward movement of GBP / USD to the upper boundary of the 1/2 Median Line channel (143.35) of the Minuette operational scale forks and the final Shiff Line Minuette (145.95).
On the other hand, the breakdown of the lower boundary (support level of 142.40) of the 1/2 Median Line Minuette channel will lead to the continuation of the downward movement of GBP / JPY to the initial SSL line (141.55) of the Minuette operational scale forks with the prospect of updating local minimums (141.22 - 140.90 - 140.93).
The details of the GBP / JPY movement, depending on the breakdown direction of the above 1/2 Median Line Minuette channel, are shown in the animated chart.
____________________
The review was compiled without taking into account the news background. Thus, the opening trading sessions of major financial centers does not serve as a guide to action (placing orders "sell" or "buy").
The formula for calculating the dollar index:
USDX = 50.14348112 * USDEUR0.576 * USDJPY0.136 * USDGBP0.119 * USDCAD0.091 * USDSEK0.042 * USDCHF0.036.
where the power coefficients correspond to the weights of the currencies in the basket:
Euro - 57.6%;
Yen - 13.6% ;
Pound Sterling - 11.9%;
Canadian dollar - 9.1%;
Swedish krona - 4.2%;
Swiss franc - 3.6%.
The first coefficient in the formula leads the index to 100 at the starting date - March 1973, when the main currencies began to be freely quoted relative to each other.
The material has been provided by InstaForex Company - www.instaforex.com