Crypto Industry News:
The growing number of retail investors is betting on Bitcoin as a hedge against macroeconomic turmoil during the protracted trade war between the US and China.
Data from industry-specific financial portals reveal a correlated increase in both Bitcoin and Gold on its trading platforms after the announcement of an escalation of trade tensions between the US and China.
While gold has long been considered a safe haven in periods of macroeconomic or geopolitical instability, stock market data point to the growing perception of Bitcoin among investors as a form of "digital gold" and a means of thesaurization in an uncertain global climate, as Bitcoin has similar characteristics to gold: it will only the finite amount (21 million) of BTC is decentralized, its price is not influenced by inflation and has an additional advantage over gold due to lower storage costs.
There are several factors that still hinder Bitcoin's acceptance as a primary safeguard, noting that its reputation is still undermined by perceived price volatility, alleged market manipulation and the prevalence of hacking intrusions in the cryptocurrency sector.
Technical Market Overview:
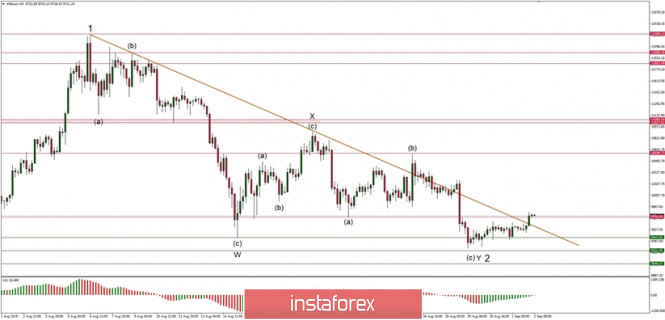
The BTC/USD pair has been trading for all the weekend inside of a narrow range located between the levels of $9,415 - $9,704. The bulls are still testing the upper boundary of this range which is still a technical resistance for the price. In the case of a breakout higher, the market will move towards the level of $9,826, which is the nearest technical resistance. Please notice, that from the Elliott Wave theory point of view, the market is very close to terminate the wave Y of the corrective cycle in the wave 2, or this cycle had been completed already and the market is ready to resume the up trend.
Weekly Pivot Points:
WR3 - $11,528
WR2 - $11,079
WR1 - $10,223
Weekly Pivot Point - $9,753
WS1 - $8,875
WS2 - $8,358
WS3 - $7,589
Trading Recommendations:
The best strategy in the current market conditions is to trade with the larger timeframe trend, which is still up. All the shorter timeframe moves are being treated as a correction inside of the uptrend. The larger degree WXY correction might have been completed and the market might be ready for another impulsive wave up of a higher degree. Any violation of the level of $9,049 invalidates the bullish impulsive scenario.