
EUR/USD
The euro fell by 47 points under external and internal pressure on Tuesday. At first, these were pessimistic indicators of ZEW business sentiment, then there was pressure from candidates for Great Britain's prime minister, Boris Johnson and Jeremy Hunt, regarding the conditions of Brexit and resulting in a strong decline in the pound, then strong data on retail sales in the United States were released.
The German ZEW business sentiment index for July fell from -21.1 to -24.5, while in the euro zone the index deteriorated from -20.2 to -20.3. The trade balance for May showed an increase from 15.7 to 20.2, but the pound sterling had already dropped by 50 points by this time. Retail sales in the US in June showed an increase of 0.4% against expectations of 0.1%. Industrial production showed zero growth in June, with a drop in capacity utilization to 77.9% from 78.1%, which in general did not cause pessimism.
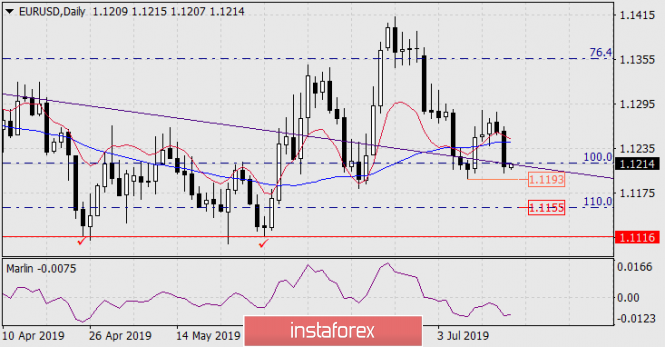
On the daily scale chart, the price went below the price channel line and the Fibonacci level is 100.0%. Here, below the lines, there may not be a long consolidation, a set of forces before going under the signal level of 1.1193, after which we expect a long-term decline towards targets 1.1155 (Fibonacci level 110.0%), 1.1116 (a low of 30 May and 25 April).
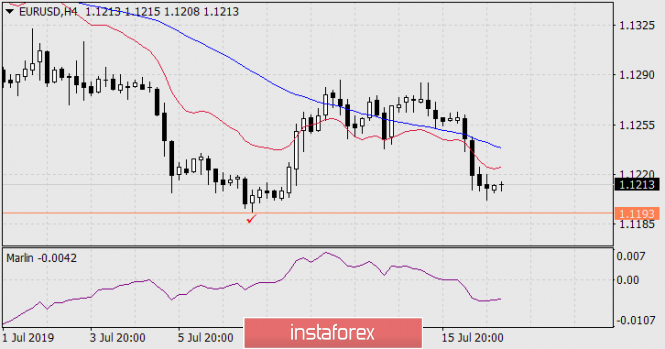
On the four-hour chart, the price consolidated below the balance and MACD lines, while the Marlin oscillator indicates a steady decline in the trend.
The material has been provided by InstaForex Company - www.instaforex.com