
On March 29, a visit towards the price levels of 1.2980 (the lower limit of the newly-established bearish movement channel) could bring the GBPUSD pair again towards the upper limit of the minor bearish channel around (1.3160-1.3180).
Since then, Short-term outlook has turned into bearish with intermediate-term bearish targets projected towards 1.2900 and 1.2850.
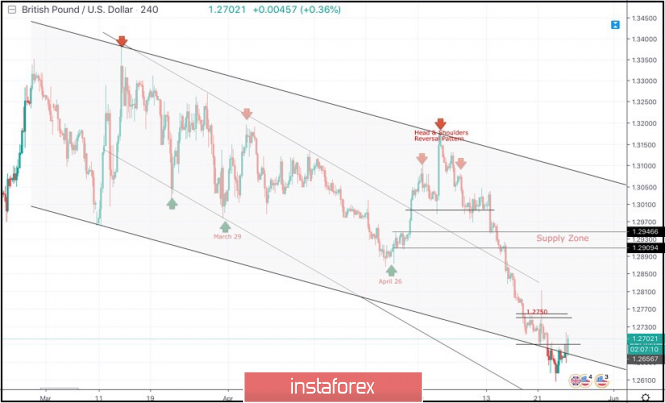
On April 26, another bullish pullback was initiated towards 1.3000 (the same bottom of March 29) which has been breached to the upside until May 13 when a bearish Head and Shoulders pattern was demonstrated on the H4 chart with neckline located around 1.2980-1.3020.
That's why, the price zone of 1.3000-1.3020 turned to become a prominent supply-zone where a valid bearish entry was offered few weeks ago.
Bearish persistence below 1.2980 (Neckline of the reversal pattern) enhanced further bearish decline.
Initial bearish Targets were already reached around 1.2900-1.2870 (the backside of the broken channel) which failed to provide any bullish support for the pair.
Further bearish decline was demonstrated towards the lower limit of the long-term channel around (1.2700-1.2650).
The GBPUSD pair looks oversold around the current price levels (1.2650-1.2700). That's why, SELL signals shouldn't be considered at such low prices.
On the other hand, bullish persistence above 1.2690 and 1.2750 is needed to enhance the bullish side of the market towards 1.2870 (Bottom of April 26).
Trade Recommendations:
Conservative traders should wait for another bullish pullback towards 1.2870-1.2905 (newly-established supply zone) to look for valid sell entries. S/L should be placed above 1.2950.
Counter-trend traders can consider the current bullish breakout above 1.2690-1.2700 as a valid BUY signal. T/P level to be located around 1.2750 and 1.2820. S/L to be located below 1.2640.
The material has been provided by InstaForex Company - www.instaforex.com