
4-hour timeframe
The amplitude of the last 5 days (high-low): 58p - 29p - 24p - 46p - 31p.
Average amplitude for the last 5 days: 38p (41p).
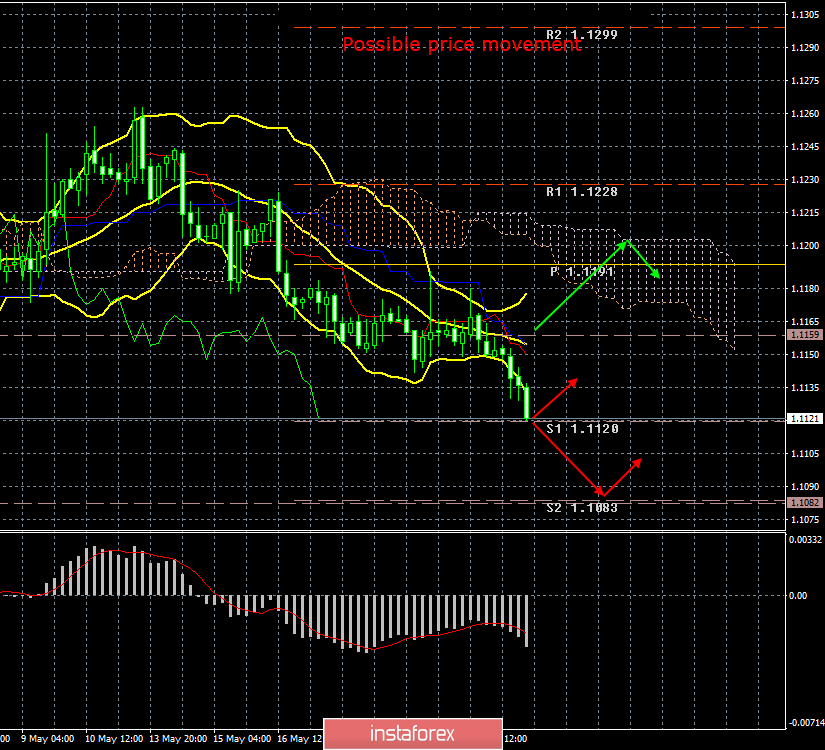
On the penultimate trading day of the week, the euro/dollar pair resumed to decline and has already completed the first support level of 1.1120 and came close, as we expected, to the lows of April 26. In the morning we noted that, despite the preliminary values of business activity indexes in the services and production sectors of the eurozone, the market reaction to them will follow, because now all three values are close to the key level 50, above which the positive trend persists, below - the negative begins. The index of business activity in the manufacturing sector has already slipped below the level of 50, and today it has become known that this indicator turned out to be worse than the forecast and the previous value (47.7). This indicates a downward turn in the industry, which is another drawback to the collection of all the problems of the eurozone. This is another answer to the question as to why the US dollar continues to grow. Because traders, big players, analyze the economic situations of the US and the EU and do not see anything optimistic about the eurozone. Therefore, the demand for the US dollar remains stable, and traders are trying to get rid of the euro. Euro purchases are rare and short-term. A little later in the US, there will be a similar release of that of the European business activity indices, and if they turn out to be better than market expectations, the bears will raise the pressure on the pair and the euro currency. The technical picture for the EUR/USD pair is now almost unequivocal. All indicators are pointing down, all the turns of the correction ended exactly around the critical line. Thus, the initiative for the pair remains in the hands of bears.
Trading recommendations:
The EUR/USD pair resumed its downward movement. Thus, now it is recommended to continue to follow the trend, that is, to sell the euro in order to support the level of 1.1083.
It is advised that you return to buying once traders manage to overcome the Kijun-sen line. In this case, the first target for buying the currency pair will be the upper boundary of the Ichimoku cloud.
In addition to the technical picture also take into account the fundamental data and the time of their release.
Explanation of the illustration:
Ichimoku indicator:
Tenkan-sen - the red line.
Kijun-sen - the blue line.
Senkou Span A - light brown dotted line.
Senkou Span B - light purple dotted line.
Chikou Span - green line.
Bollinger Bands indicator:
3 yellow lines.
MACD Indicator:
Red line and histogram with white bars in the indicator window.
The material has been provided by InstaForex Company - www.instaforex.com