
To open long positions on GBP/USD you need:
It is best to return to buying the pound with a correction from larger support levels around 1.2984 and 1.2916. However, in the first half of the day, you can also count on the formation of a false breakdown in the area of 1.3025. Only in this case would we be able to expect a re-wave of growth in GBP/USD with a consolidation above the resistance of 1.3058, which will strengthen the upward momentum and return the pair to the highs of 1.3106 and 1.3159, where I recommend taking profits.
To open short positions on GBP/USD you need:
Sellers need to consolidate below the support level of 1.3025 or the formation of a false breakdown in the area of resistance 1.3058, which will increase the pressure on the pair and lead to a larger wave of selling, with a yield of a low of 1.2984, where I recommend taking profits. However, the main task of sellers at the end of the week will be to update the support of 1.2916. In the event of further growth in the trend, you can open short positions from a high of 1.3106 and 1.3159.
Indicator signals:
Moving averages
Trade is conducted in the area of 30-day and 50-day moving, which indicates the lateral nature of the market.
Bollinger bands
The pound's growth for today may limit the upper limit of the Bollinger Bands indicator in the region of 1.3083. A break of the lower border of the indicator around 1.3012 will lead to a larger decrease in the pound.
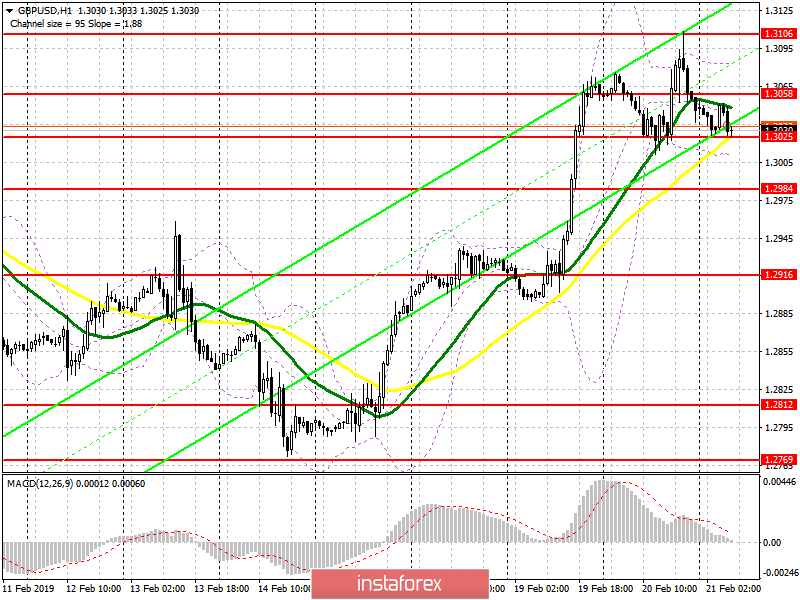
Description of indicators
- MA (moving average) 50 days - yellow
- MA (moving average) 30 days - green
- MACD: fast EMA 12, slow EMA 26, SMA 9
- Bollinger Bands 20