
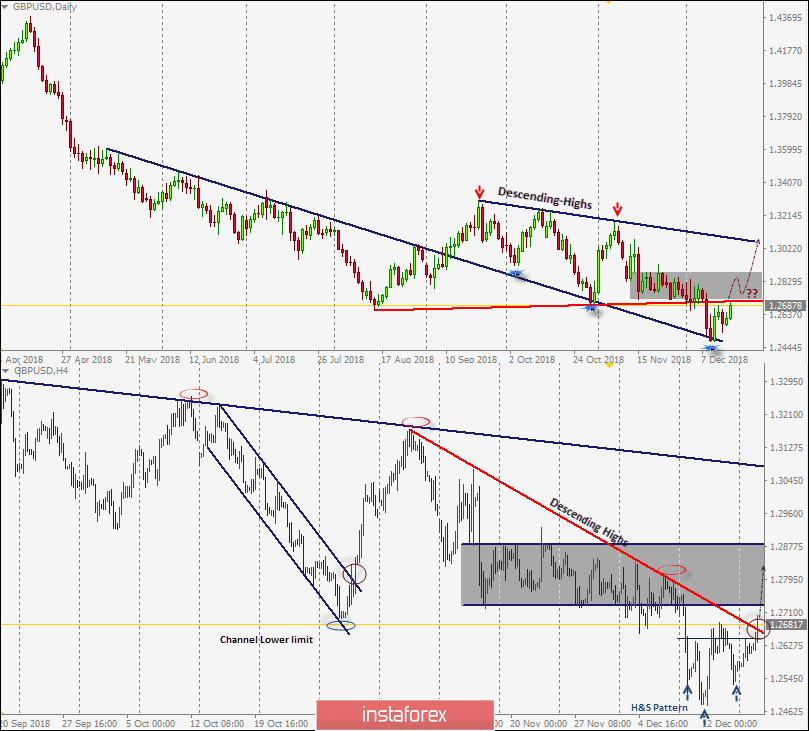
Since Mid-November, Successive Lower Highs were demonstrated below the depicted H4 downtrend line around the price levels of 1.2870 and 1.2780.
Shortly after, a quick decline was demonstrated towards the price level of 1.2500 before bullish recovery could take place on December 12.
A bullish Head & Shoulders pattern is being demonstrated on the H4 chart with the neckline located around 1.2660-1.2680. Pattern confirmation projects a bullish target towards 1.2880 again.
On the other hand, the current scenario could pursue as a bearish flag continuation pattern provided that bearish persistence below 1.2660 (corresponding to a prominent daily low) is maintained on a daily basis.
The current bullish pullback towards the price zone of 1.2660-1.2700 can be watched for a valid SELL entry as this price zone corresponds to the backside of the broken consolidation range as well as the depicted downtrend on H4 chart.
Projected target for the bearish flag continuation pattern is located around 1.2300. Initial bearish destination is located around 1.2580 while S/L should be set as daily closure above 1.2800.
The material has been provided by InstaForex Company - www.instaforex.com