
Dear colleagues.
For the EUR / USD pair, the price so far forms a local downward structure from September 6, the level of 1.1601 is the key support. For the GBP / USD pair, we follow the formation of the upward structure from September 5, we continue to wait for the continuation of the upward movement after the breakdown of 1.2983. For the USD / CHF, the price forms the potential for the top of September 7 in the correction of the downward structure, the level of 0.9718 is the key resistance. For the USD / JPY, the price is in deep correction and forms the structure for the top of September 7, level 111.25 is the key resistance. For the EUR / JPY, the subsequent goals for the bottom were determined from the local downward structure on September 5. For the GBP / JPY pair, the price is in the correction area from the downward structure on August 30.
Forecast for September 10:
Analytical review of currency pairs in the scale of H1:
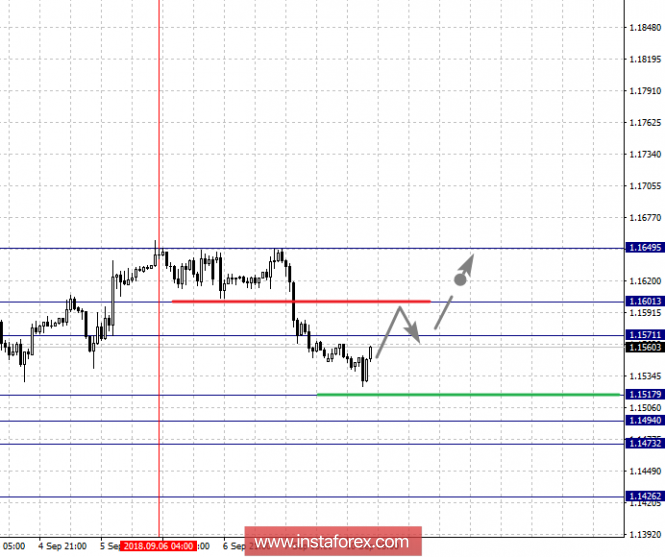
For the EUR / USD pair, the key levels on the scale of H1 are: 1.1649, 1.1601, 1.1571, 1.1517, 1.1494, 1.1473 and 1.1426. Here we follow the formation of the local structure for the bottom of September 6. The continuation of the downward movement is expected after the breakdown of 1.1517. In this case, the target is 1.1494. Near this level is the consolidation of the price. Passing the price of the noise range 1.1494 - 1.1473 will lead to the development of a pronounced movement. In this case, the target is 1.1426, from this value we expect a rollback to the top.
Short-term upward movement is possible in the area of 1.1571-1.1601. The breakdown of the latter value will lead to the formation of an upward structure. Here, the potential target is 1.1649.
The main trend is the formation of local initial conditions for the bottom of September 6.
Trading recommendations:
Buy 1.1571 Take profit: 1.1600
Buy 1.1604 Take profit: 1.1649
Sell: 1.1516 Take profit: 1.1495
Sell: 1.1472 Take profit: 1.1430
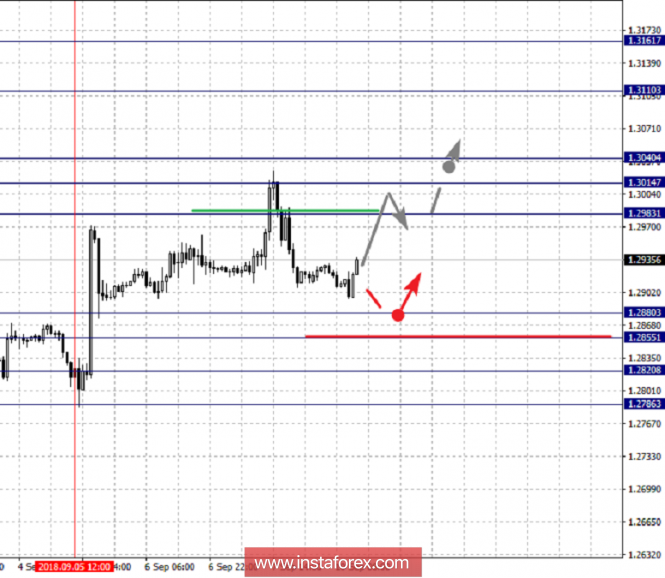
For the GBP / USD pair, the key levels on the H1 scale are 1.3161, 1.3110, 1.3040, 1.3014, 1.2983, 1.2880, 1.2855, 1.2820 and 1.2786. Here the price forms the potential for the top of September 5. Continuation of traffic on the upside is expected after the breakdown of 1.2983. In this case, the target is 1.3014. In the area of 1.3014 - 1.3040 is the consolidation of the price. Break of level 1.3040 should be accompanied by a pronounced movement towards the top. Here, the target is 1.3110. The potential value for the upstream structure is the level of 1.3161.
Short-term downward movement is possible in the area of 1.2880 - 1.2855. The breakdown of the last value will lead to in-depth correction. Here, the target is 1.2820. This level is the key support for the top. Its breakdown will lead to a downward movement. Here, the target is 1.2786.
The main trend is the formation of the potential for the top of September 5.
Trading recommendations:
Buy: 1.2983 Take profit: 1.3014
Buy: 1.3042 Take profit: 1.3110
Sell: 1.2880 Take profit: 1.2857
Sell: 1.2853 Take profit: 1.2820
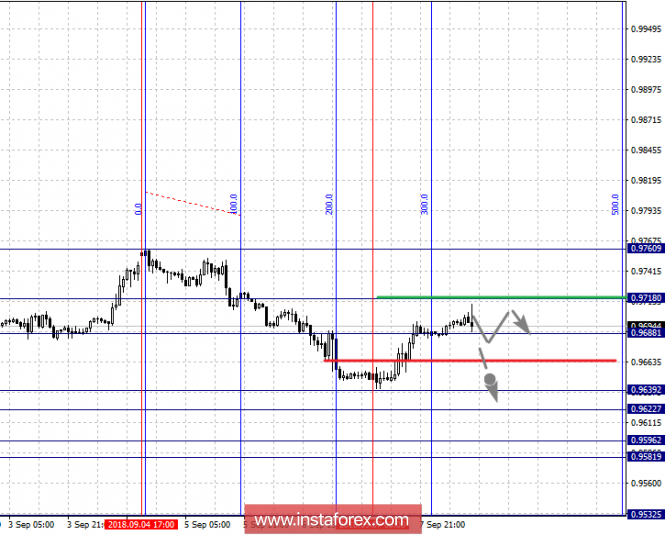
For the USD / CHF, the key levels on the scale of H1 are: 0.9718, 0.9688, 0.9667, 0.9639, 0.9622, 0.9596 and 0.9581. Here we follow the development of the local downward structure from September 4. At the moment, the price is in correction and forms the potential for the top of September 7, the development of which is expected after the breakdown of 0.9718. Short-term downward movement is possible in the area of 0.9639 - 0.9622. The breakdown of the last value will lead to the development of a pronounced movement. Here, the target is 0.9596, the potential value for the bottom is the level of 0.9581, upon reaching which we expect consolidation in the area of 0.9581 - 0.9596, and also a rollback upward.
The main trend is the downward structure from September 4, the stage of deep correction.
Trading recommendations:
Buy: 0.9690 Take profit: 0.9717
Buy: 0.9720 Take profit: 0.9760
Sell: 0.9638 Take profit: 0.9624
Sell: 0.9620 Take profit: 0.9596
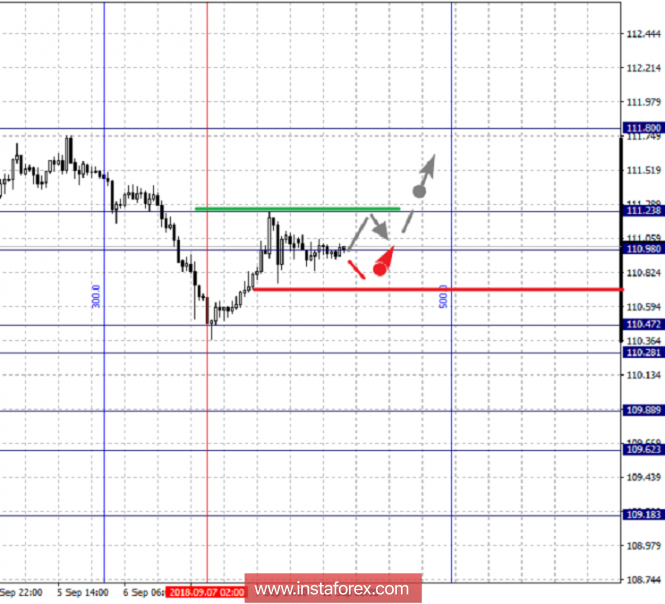
For the USD / JPY, the key levels on a scale are: 111.80, 111.23, 110.98, 110.47, 110.28, 109.88, 109.62 and 109.18. Here the price is in deep correction from the downward structure and forms the potential for the top of September 7. The continuation of the downward movement is expected after passing the price of the noise range 110.47 - 110.28. In this case, the target is 109.88. In the area of 109.88 - 109.62 is the consolidation of the price. Potential value for the bottom is the level of 109.18, the movement towards which we expect after the breakdown of 109.60.
Short-term upward movement is possible in the area of 110.98 - 111.23. The breakdown of the latter value will lead to the development of the upward structure from September 7. In this case, the target is 111.80.
The main trend: the medium-term downward structure of August 28, the stage of deep correction.
Trading recommendations:
Buy: 111.00 Take profit: 111.23
Buy: 111.25 Take profit: 111.80
Sell: 110.47 Take profit: 110.30
Sell: 110.25 Take profit: 109.90
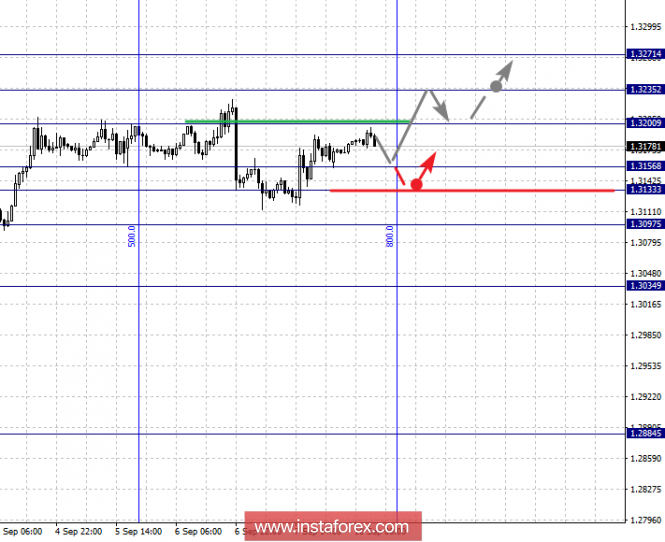
For the CAD / USD pair, the key levels on the H1 scale are: 1.3271, 1.3235, 1.3200, 1.3156, 1.3133 and 1.3097. Here, in order to continue the development of the upward trend, we expect the formulation of local initial conditions. Continuation of the main trend is expected after the breakdown of the level of 1.3200. In this case, the target is 1.3235, from this level the probability of leaving for correction is high. As a potential move for the top, consider the level of 1.3271, upon reaching which we expect a pullback downwards.
Short-term downward movement is possible in the area of 1.3156 - 1.3133. The breakdown of the last value will lead to in-depth correction. In this case, the target is 1.3097. This level is the key support for the upward structure.
The main tendency is to expect a local structure for the top.
Trading recommendations:
Buy: 1.3200 Take profit: 1.3233
Buy: 1.3237 Take profit: 1.3270
Sell: 1.3155 Take profit: 1.3135
Sell: 1.3130 Take profit: 1.3097
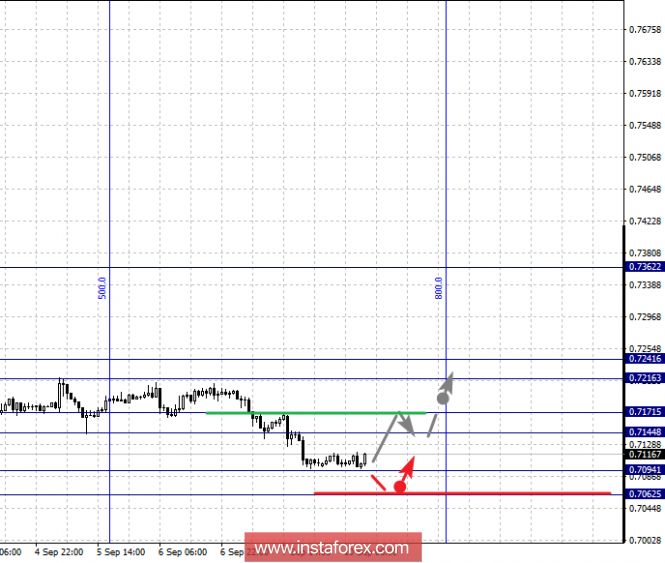
For the AUD / USD pair, the key levels in the scale of H1 are: 0.7241, 0.7216, 0.7171, 0.7144, 0.7094 and 0.7062. Here we follow the downward structure of August 28. Short-term downward movement is expected in the range 0.7094 - 0.7062, from this area of there is a high probability of a turn upwards, we do not set further targets for the downward movement.
Short-term upward movement is possible in the area of 0.7144 - 0.7171. The breakdown of the latter value will lead to the formation of the potential for initial conditions for the top. In this case, the target is 0.7216, the range 0.7216 is 0.7241 noise.
The main trend is the downward structure from August 28, we expect a pullback upward.
Trading recommendations:
Buy: 0.7144 Take profit: 0.7170
Buy: 0.7173 Take profit: 0.7210
Sell: 0.7092 Take profit: 0.7062
Sell: Take profit:
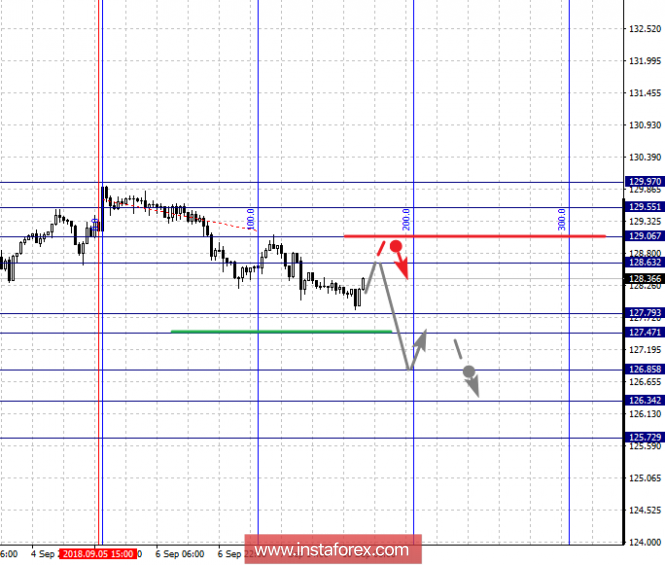
For the of EUR / JPY, the key levels on the scale of H1 are: 129.97, 129.55, 129.06, 128.63, 127.79, 127.47, 126.85, 126.34 and 125.72. Here, we determined the subsequent goals for the downward movement from the local structure on 5 September. The continuation of the downward movement is expected after passing the price of the noise range of 127.79 - 127.47. In this case, the target is 126.85. In the area of 126.85 - 126.34, short-term downward movement and is the consolidation of the price. The potential value for the bottom is the level of 125.72, from which we expect a rollback to the top.
Short-term upward movement is possible in the range 128.63 - 129.06. The breakdown of the last value will lead to an in-depth correction. Here, the target is 129.55. Up to the level of 129.97 we expect formalized initial conditions for the upward cycle.
The main trend is the local downward structure of September 5.
Trading recommendations:
Buy: 128.63 Take profit: 129.02
Buy: 129.10 Take profit: 129.55
Sell: 127.45 Take profit: 126.85
Sell: 126.82 Take profit: 126.35
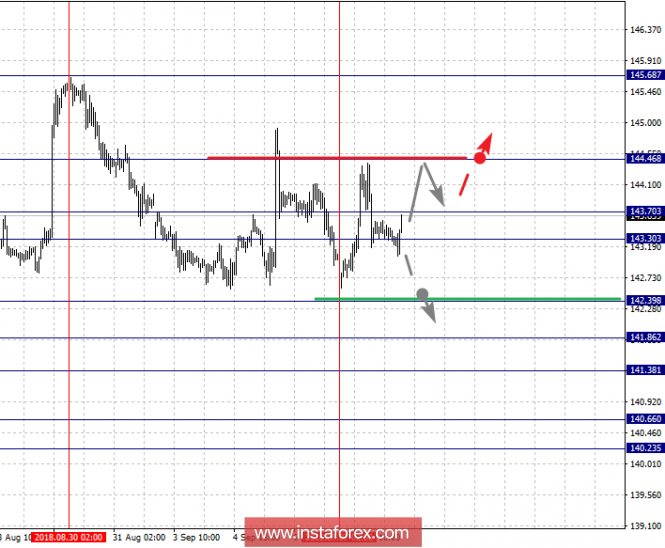
For the GBP / JPY pair, the key levels on the scale of H1 are: 144.46, 143.70, 143.30, 142.39, 141.86, 141.38, 140.66 and 140.23. Here the price is in the correction area from the downward structure and forms a small potential for the top of September 7. The continuation of the downward movement is expected after the breakdown at 142.39. In this case, the target is 141.86. In the area of 141.86 - 141.38 is the consolidation of the price. The level breakdown at 141.38 should be accompanied by a pronounced downward movement. Here, the target is 140.66, the potential value for the bottom is the level of 140.23, after which we expect consolidation, and also a rollback to the top.
Consolidated traffic is possible in the area of 143.30 - 143.70. The breakdown of the last value will lead to in-depth correction. Here, the target is 144.46. This level is the key support for the bottom.
The main trend is the medium-term downward structure of August 30, the correction stage.
Trading recommendations:
Buy: 143.70 Take profit: 144.40
Buy: 144.50 Take profit: 145.65
Sell: 142.35 Take profit: 141.86
Sell: 141.80 Take profit: 141.40
The material has been provided by InstaForex Company - www.instaforex.com