
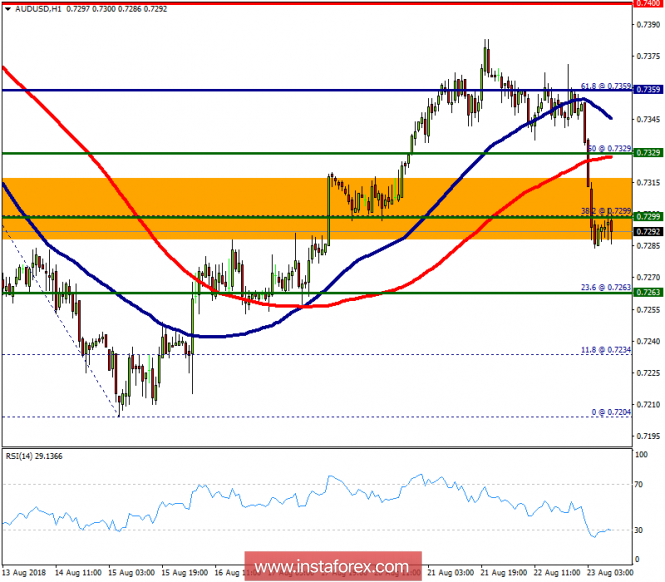
Pivot : 0.7359.
The AUD/USD pair continued to move upwards from the level of 0.7300. Since yesterday, the pair has risen from the level of 0.7299 (the level of 0.7299 coincides with the ratio of 38.2% Fibonacci Expansion) to the top around 0.7359. In consequence, the AUD/USD pair broke resistance at 0.7329, which turned into strong support at the level of 0.7329. In the H1 time frame, the level of 0.7299 is expected to act as major support today. Currently, the price is moving in a bullish channel. This is confirmed by the RSI indicator signaling that we are still in a bullish market. The price is still above the moving average (100) and (50). From this point, we expect the AUD/USD pair to continue moving in the bullish trend from the support level of 0.7359 towards the target level of 0.7400. If the pair succeeds in passing through the level of 0.7400, the market will indicate the bullish opportunity above the level of 0.7400 so as to reach the second target at 0.7454 (the double top). At the same time, if the AUD/USD pair is able to break out the level of 0.7329, the market will decline further to 0.7263.
The material has been provided by InstaForex Company - www.instaforex.com