The global investors had to wait for almost seven months until the SP500 index set a historic new all-time high. Everything took place quietly and as if with such a measure of shyness. But the high is high and it may soon be the longest bull market in post-war US history.
Tuesday's macroeconomic calendar was practically empty. Quarterly results of the large developer Toll Brothers proved to be a support for stock exchange bulls, whose shares have increased by over 13%. Turks had their free day, which for some time allowed the headlines to be removed from the Turkish currency crisis. We'll see how long it will take to calm down on the Bosporus.
The maximum value of the SP500 during Tuesday's session was 2873.33 points. The January record of all time has been improved by only 0.36 points. Formally, we have a new record, but in practice, it is just the alignment of the previous one and the threat of creating a double high remains on the table. Nevertheless, in the second part of the session, the New York indexes did not maintain the initial increases. The SP500 ended the day with an increase of only 0.23% and a result of 2,862.96 points. Dow Jones went up by 0.25%, and Nasdaq by 0.49%.
The new maximum after the increase of over 1% was determined by the affiliate of the smaller US companies, the Russell2000 index. This ratio has gained almost 12% since the beginning of the year, falling better than SP500 (+ 7% YTD), Dow Jones (+ 4.5%) and losing only to Nasdaq Composite (+ 14%).
According to the US financial media, the current boom on Wall Street is already 3,452 days long and has just equalized the record from the 90s of the twentieth century, when the indexes grew for almost a whole decade. The bull market in the US dates its birth on March 6, 2009.
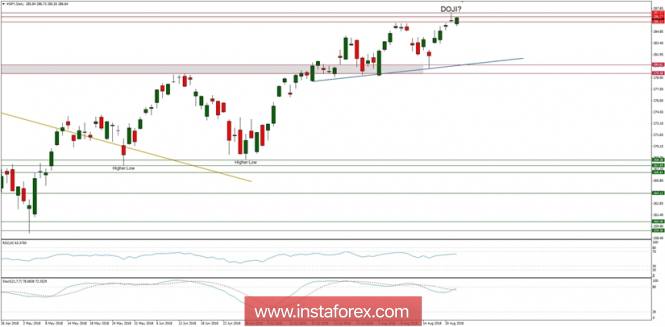
Let's then take a look at the SP500 technical picture in the daily time frame. The market has made a Doji candlestick formation, which might indicate a possible correction in the uptrend. However, the Doji candlestick formation has not yet been confirmed, so the traders need to wait until the daily candle will close. The long-term trend is still up and this would be the first clue regarding a possible trend reversal as well. The nearest support is seen at the level of 284.97 and the key technical support is located at the level of 279.48.