MG Network

something big isHappening!

In the mean time you can connect with us with via:

Copyright © Money Grows Network | Theme By Gooyaabi Templates

Money Grows Network

Archive

Powered by Blogger.

Welcome To Money Grows Network

Verified By

2006 - 2019 © www.moneygrows.net

Investments in financial products are subject to market risk. Some financial products, such as currency exchange, are highly speculative and any investment should only be done with risk capital. Prices rise and fall and past performance is no assurance of future performance. This website is an information site only.

Popular

Pages

Expert In

Name*


Message*

GBP/USD analysis for August 31, 2018

analytics5b893745c1aa8.png

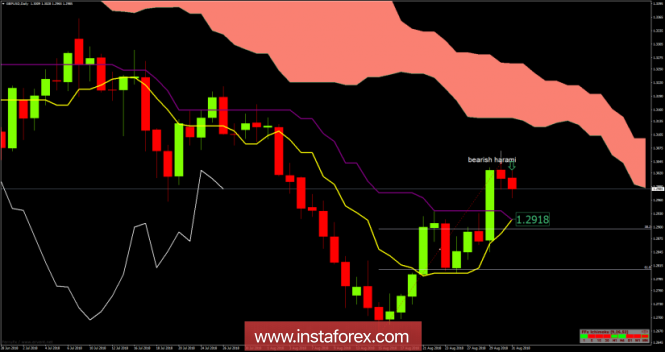
Recently, the GBP/USD pair has been trading sideways at the price of 1.3000. According to the Daily time – frame, I found a bearish harami candlestick pattern in the background, which is a sign that buying looks risky and that selling might be the right play. The price is trading below the cloud, which is a sign that trend is downward. Watch for selling opportunities. The downward target is set at the price of 1.2918 (kijun-sen + tankan-sen).

Key resistance – 1.3042

Support and downward target – 1.2918 (Kijun sen + Tenkan sen)

Trading recommendations for today: watch for potential selling opportunities.

The material has been provided by InstaForex Company - www.instaforex.com