
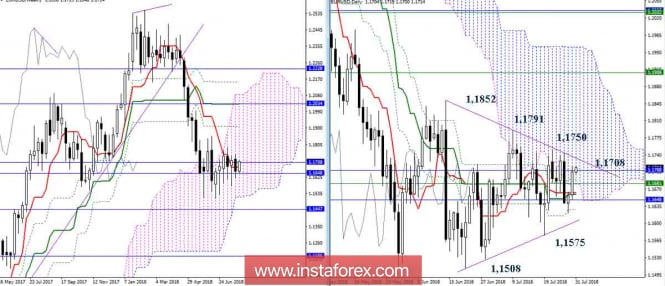
EUR / USD
Uncertainty, which lasts for quite a long time, is preserved. The initiative is now on the side of the players to raise, they again rose to the resistance of 1.1708 (the monthly Fibo Kijun) and make an attempt to gain a foothold in the daytime cloud. The way out of the zone of uncertainty, through the update of the maximum extremes (1.1750 - 1.1791 - 1.1852), will allow players to continue to rise on the rise. Landmarks for recovery are weekly levels (1.1908 - 1.2032) and the upper boundary of the daytime cloud. Bears to leave the zone of uncertainty, also need to overcome the extremes (1.1575 - 1.1508), then the main task for them will be the breakdown of the lower boundary of the weekly cloud and the formation of the downside target.
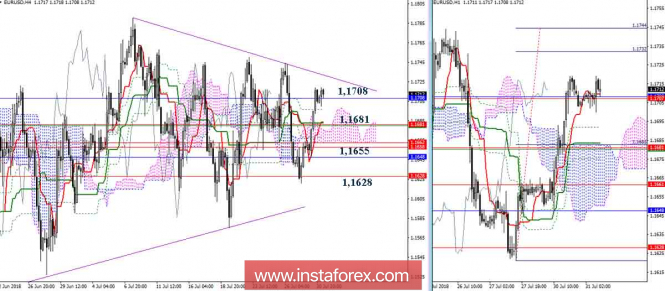
Lateral movement led to the fact that the pair is spinning around the clouds of younger timeframes, not working out some goals for the breakdown of the cloud. At the moment, the advantage is on the players' side to raise. The main task for them is to exit the zone of uncertainty. Support can be noted on 1,1681 - 1,1655 - 1,1628. The fastening below will give the initiative to the hands of bears, for which the desire to leave the zone of uncertainty will also serve as the main task in the first stage.
Indicator parameters:
All time intervals 9 - 26 - 52
The color of indicator lines:
Tenkan (short-term trend) - red,
Kijun (medium-term trend) - green,
Fibo Kijun is a green dotted line,
Chinkou is gray,
Clouds: Senkou Span B (SSB, long-term trend) - blue,
Senkou Span A (SSA) - pink.
The color of additional lines:
Support and resistance MN - blue, W1 - green, D1 - red, H4 - pink, H1 - gray,
Horizontal levels (not Ichimoku) - brown,
Trend lines - purple.
The material has been provided by InstaForex Company - www.instaforex.com