
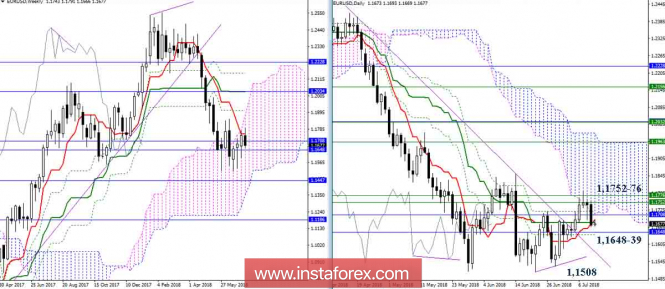
EUR / USD
Players on the rise reach the resistance zone of 1.1752-76 (the lower boundary of the day cloud + weekly levels), which seems difficult to overcome. As a result, we observe the formation of a weekly rebound from the Tenkan level 1.1752. If the pair can close the current week below supports 1.1680 (day cross) and 1.1648-39 (month Senkou Span A + day Fibo Kijun), then we can expect the preservation of sentiment and their strengthening. In this case, the main task for the players to decline is to update the minimum extremum (1.1508).
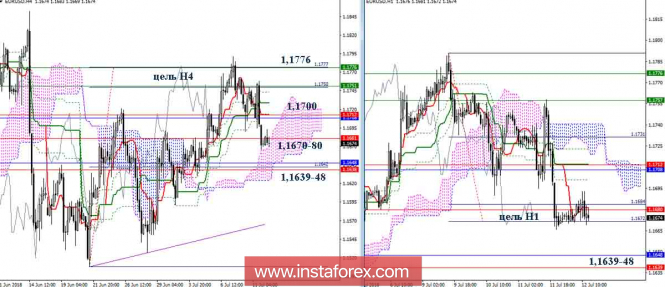
Together with the testing of resistances in the area of 1.1752-76, the target for the breakdown of the H4 cloud was already completed. As a result, the decline turned out to be deep enough, and now the pair tests again the strength of consolidation supports in the high-time levels (day cross 1,1680) and important lines from H4 and H1 (target for breakdown of the cloud H1 1.1672 + cloud H4 1.1670 ). If the players on the rise now keep the situation under control, we can expect an upswing (important resistance 1,1700-20) and a new attempt to go beyond 1.1776. The supports that should be noted are the levels 1.1639-48, the consolidation below will allow to pierce the H4 cloud and form a new downside target.
Indicator parameters:
all time intervals 9 - 26 - 52
Color of indicator lines:
Tenkan (short-term trend) - red,
Kijun (medium-term trend) - green,
Fibo Kijun is a green dotted line,
Chinkou is gray,
clouds: Senkou Span B (SSB, long-term trend) - blue,
Senkou Span A (SSA) - pink.
Color of additional lines:
support and resistance MN - blue, W1 - green, D1 - red, H4 - pink, H1 - gray,
horizontal levels (not Ichimoku) - brown,
trend lines - purple.
* The presented market analysis is informative and does not constitute a guide to the transaction.
The material has been provided by InstaForex Company - www.instaforex.com