
Gold price remains inside the downward sloping wedge pattern. Gold price remains in a bearish trend. Gold bulls need to break above $1,300 for a confirmed break out and for a bounce at least towards $1,330-40.
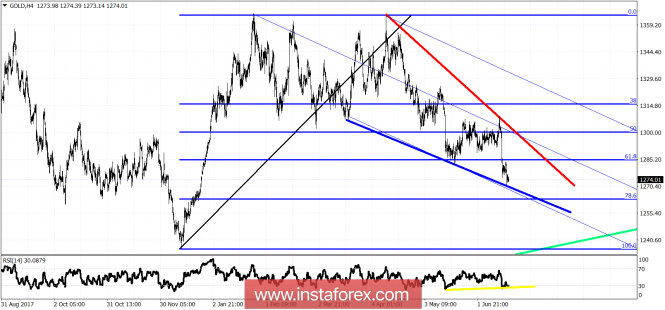
Red line - resistance
Blue line - support
Yellow line - bullish RSI divergence
Gold price is in an attractive for buying area. Gold price potential is to the upside and not to the downside. Despite the new lows yesterday the RSI did not confirm this new low. Gold price in the short-term will at least move towards the red downward sloping trend line resistance. Support is at $1,270. Resistance is at $1,297-$1,300. A break above $1,300 will be a very bullish sign. A rejection at the $1,295-$1,300 level will open the way for a move towards $1,250-60.
The material has been provided by InstaForex Company - www.instaforex.com