
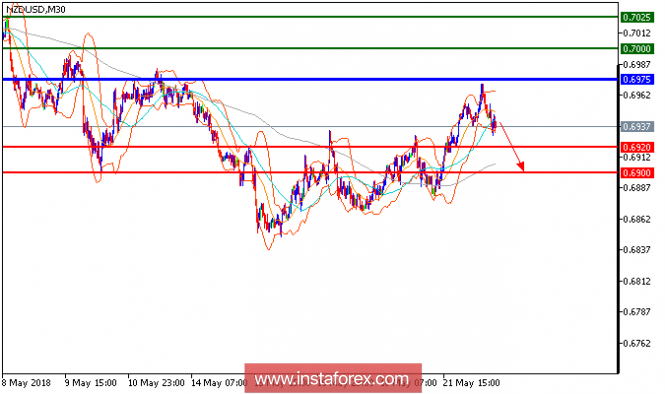
NZD/USD is expected to trade with a bearish outlook. The pair accelerated on the downside and is trading below its declining 20-period and 50-period moving averages. The relative strength index broke below its oversold level of 30, but has not displayed any reversal signal. To conclude, as long as 0.6975 is not surpassed, look for a drop to 0.6920 . A break below this level would trigger a further downside to 0.6900.
Chart Explanation: The black line shows the pivot point. Currently, the price is above the pivot point which is a signal for long positions. If it remains below the pivot point, it will indicate short positions. The red lines show the support levels, while the green line indicates the resistance levels. These levels can be used to enter and exit trades.
Resistance levels: 0.7000, 0.7025, and 0.7050
Support levels: 0.6920, 0.6900, and 0.6850
The material has been provided by InstaForex Company - www.instaforex.com