
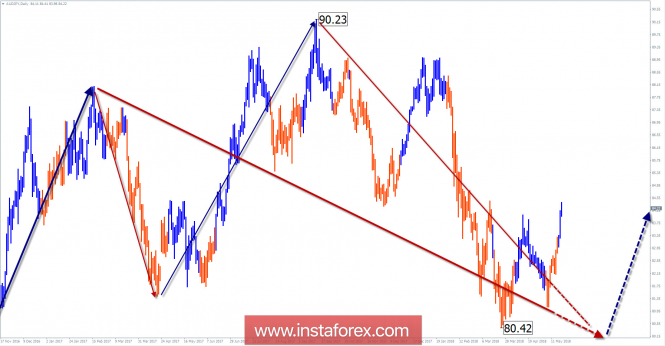
Wave picture of the chart D1:
The wave pattern of the largest scale of the cross plot shows a bullish zigzag, which started in June 2016. The structure of the motion on D1 shows that in the wave the first part (A) is fully formed and the middle part (B) is nearing completion. Correction proportions are fully met, but there are no signals for changing the motion vector yet on the graph.
The wave pattern of the graph H1:
The bullish wave counts from March 23. The wave is not complete, but the current potential is not enough to start a new uptrend.
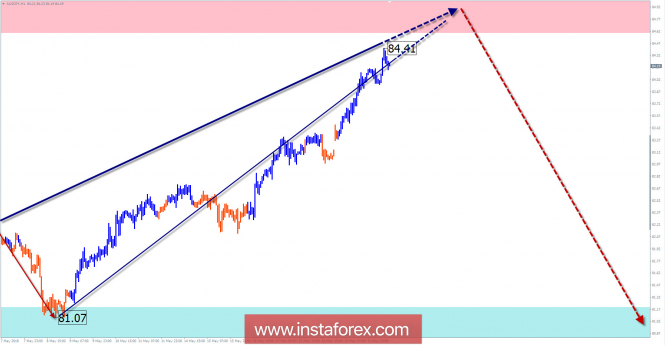
The wave pattern of the M15 chart:
The last bullish section of May 9 forms the final part of the wave zigzag of a larger wave. The price has closely approached to the lower boundary of the settlement completion zone.
Recommended trading strategy:
Purchases of the instrument will be relevant after the current bearish wave is completely over. Supporters of short-term trading in the area of the resistance zone, it makes sense to look at the signals of the sale.
Resistance zones:
- 84.60 / 85.10
Support zones:
- 81.20 / 80.70
Explanations to the figures: Simplified wave analysis uses a simple waveform, in the form of a 3-part zigzag (ABC). At each TF the last incomplete wave is analyzed. Zones show the calculated areas with the greatest probability of a turn.
Arrows indicate the wave counting according to the technique used by the author. The solid background shows the generated structure, dotted - the expected wave motion.
Attention: The wave algorithm does not take into account the duration of the tool movements in time. To conduct a trade transaction, you need confirmation signals from your trading systems!
The material has been provided by InstaForex Company - www.instaforex.com