
Wave picture of the D1 chart:
Over the past three years, the quotations of the pairs have formed an ascending stretched plane on the chart. The wave entered the final phase of the formation of the last part (C) but the wave structure does not show completeness.
The wave pattern of the H1 graph:
Since January of this year, the price movement is guided by a downward wave. Judging by the type of its structure and wave potential, the wave will take the place of correction oN the last section of the main trend. Quotations are near the upper boundary of the calculated target zone.
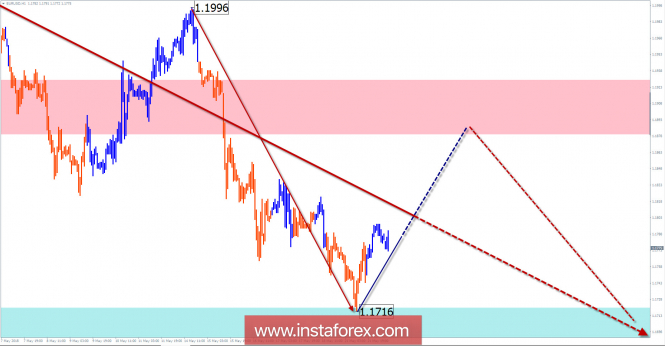
The wave pattern of the M15 chart:
As part of a larger construction, the last wave is bearish with a starting point on May 14. In the structure of the movement, an upward correction is expected in the coming days.
Recommended trading strategy:
Trading large sections of the schedule, you must wait for the completion of the entire bearish wave. Short-term purchases are possible within the framework of the intersession and the inter-style style.
Resistance zones:
- 1.1880 / 1.1930
Support zones:
- 1.1720 / 1.1670
Explanations to the figures:
A simplified wave analysis uses a simple waveform, in the form of a 3-part zigzag (ABC). The last incomplete wave for every time frame is analyzed. Zones show the calculated areas with the greatest probability of a turn.
Arrows indicate the counting of wave according to the technique used by the author. The solid background shows the generated structure and the dotted exhibits the expected wave motion.
Attention: The wave algorithm does not take into account the duration of the tool movements in time. To conduct a trade transaction, you need to confirm the signals used by your trading systems.
The material has been provided by InstaForex Company - www.instaforex.com