
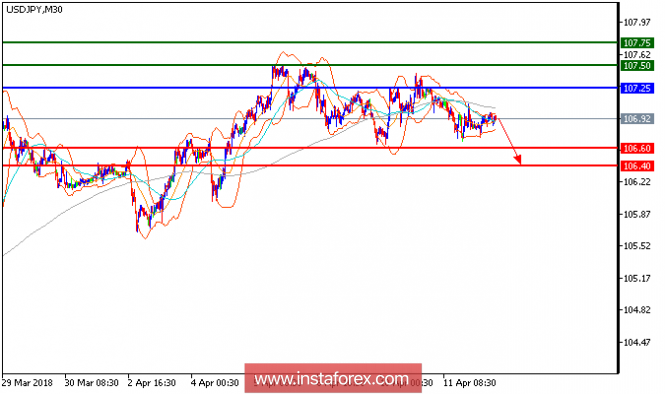
USD/JPY is under pressure and expected to trade with bearish outlook. The pair retreated from 107.05 (the previous high) and broke below its 20-period moving average after touching the 50-period moving average. The relative strength index is below its neutrality level at 50 and lacks upward momentum. Hence, as long as 107.25 is not surpassed, look for a return to 106.60 (lows of April 9 and 10). A break below of this level would trigger another decline to 106.40.
Chart Explanation: The black line shows the pivot point. The present price above the pivot point indicates a bullish position, and the price below the pivot point indicates a short position. The red lines show the support levels, and the green line indicates the resistance levels. These levels can be used to enter and exit trades.
Strategy: SELL, stop loss at 107.25, take profit at 106.60
Resistance levels: 107.50, 107.75, and 108.00. Support levels: 106.60, 106.40, and 106.00.
The material has been provided by InstaForex Company - www.instaforex.com