
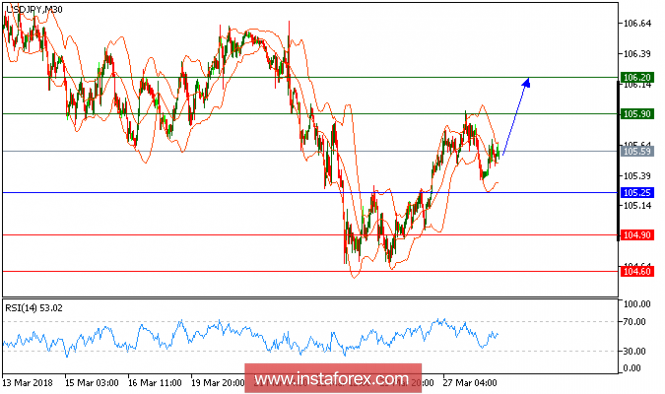
USD/JPY is expected to trade with a bullish outlook. The pair continues a rebound initiated from a low of 105.29 seen overnight (March 27). Currently, it has returned to the levels above both the 20-period and 50-period moving averages, as the relative strength index is well directed above the neutrality level of 50 calling for a new upleg. As long as the bullish bias is maintained, the pair should revisit 105.90 (around the high of yesterday) before advancing further toward 106.20.
Chart Explanation: The black line shows the pivot point. The present price above the pivot point indicates a bullish position, and the price below the pivot point indicates a short position. The red lines show the support levels, and the green line indicates the resistance levels. These levels can be used to enter and exit trades.
Strategy: BUY, stop loss at 105.25, take profit at 105.90
Resistance levels: 105.90, 106.20, and 106.50
Support levels: 104.90, 104.60, and 104.25.
The material has been provided by InstaForex Company - www.instaforex.com