
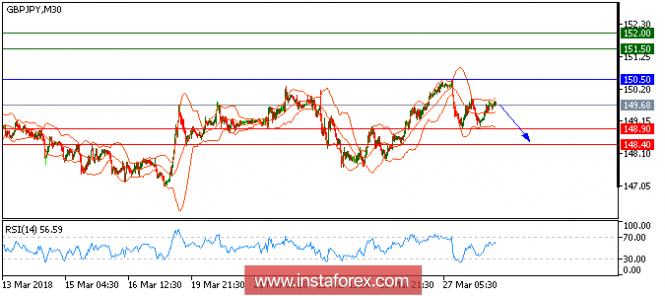
GBP/JPY is under pressure and expected to continue its downside movement after a pullback from 150.50. The pair has struck against its horizontal resistance at 150.50, which should hold on the upside. Both the 20-period and 50-period moving averages are turning down, which confirms a negative outlook. Last but not least, the relative strength index is mixed to bearish.
Therefore, as long as 150.50 is not surpassed, it is likely to decline to 148.90 and 148.40 in extension.
Chart Explanation:
The black line shows the pivot point. Currently, the price is above the pivot point which is a signal for long positions. If it remains below the pivot point, it will indicate short positions. The red lines show the support levels, while the green line indicates the resistance levels. These levels can be used to enter and exit trades.
Resistance levels: 149.95, 150.30, and 151.00.
Support levels: 147.65, 147.30, and 148.
The material has been provided by InstaForex Company - www.instaforex.com