
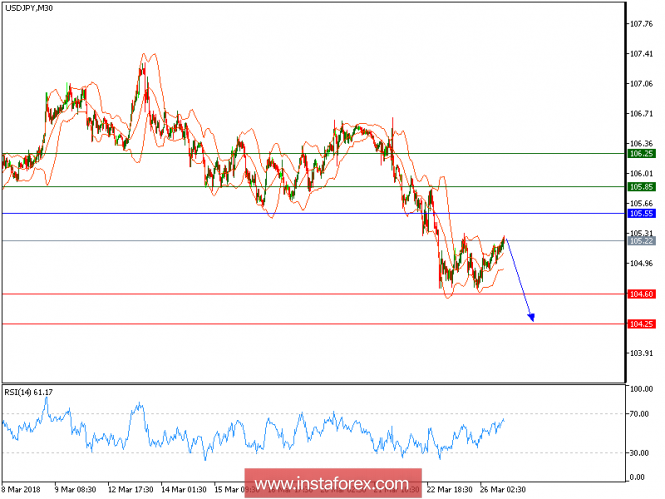
USD/JPY is expected to trade with a bearish outlook. The pair keeps testing the immediate support (first downside target) at 104.60 while being capped by both the 20-period and 50-period moving averages. The relative strength index is yet to recover the neutrality level of 50, indicating a lack of upward momentum for the pair. Key resistance is located at 105.55. As long as this key resistance is not surpassed, bearishness remains in force, and the pair is expected to cross 104.60 on the downside before sliding further toward 104.25.
Chart Explanation:
The black line shows the pivot point. The present price above the pivot point indicates a bullish position, and the price below the pivot point indicates a short position. The red lines show the support levels, and the green line indicates the resistance levels. These levels can be used to enter and exit trades.
Strategy: SELL, Stop loss at 105.55, take profit at 104.60
Resistance levels: 105.85, 106.25, and 106.60
Support levels: 104.60, 104.25, and 104.00.
The material has been provided by InstaForex Company - www.instaforex.com