
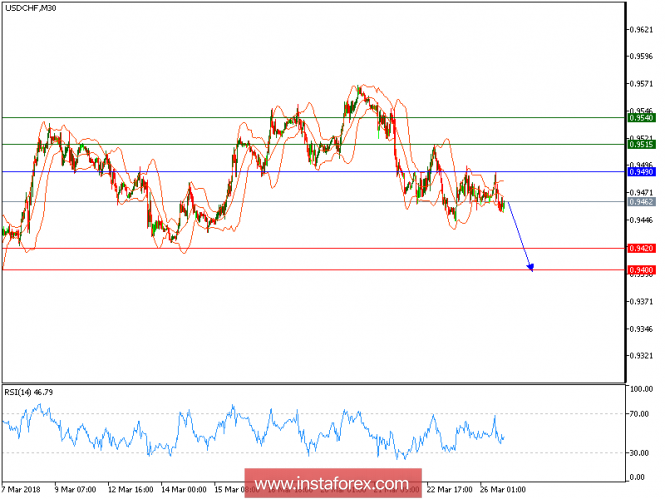
USD/CHF is under pressure and expected to trade with a bearish outlook. The pair failed to break above its major resistance at 0.9490, and is now turning down. The falling 20-period and 50-period moving averages play resistance roles, and should continue to push the prices lower. In addition, the relative strength index is bearish below its neutrality area at 50. Hence, as long as the resistance at 0.9490 is not surpassed, the risk of the break below 0.9420 remains high, below 0.9420 look for 0.9400.
Chart Explanation: The black line shows the pivot point. The present price above the pivot point indicates a bullish position, and the price below the pivot point indicates a short position. The red lines show the support levels, and the green line indicates the resistance levels. These levels can be used to enter and exit trades. Strategy: SELL, stop loss at 0.515, take profit at 0.9440.
Resistance levels: 0.9515, 0.9540, and 0.9575
Support levels: 0.9420, 0.9400, and 0.9350.
The material has been provided by InstaForex Company - www.instaforex.com