
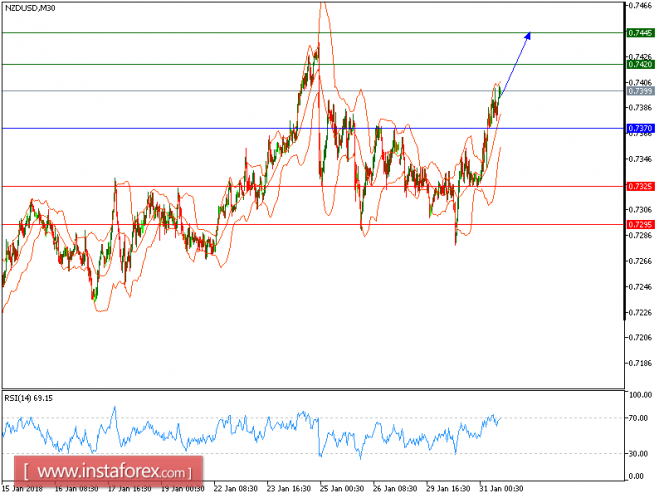
All our upside targets which we predicted in yesterday's analysis have been hit. The pair posted a rebound and broke above its 50-period moving average. In addition, the 50-period moving average is turning up. The relative strength index stays above its neutrality level at 50.
To conclude, as long as 0.737 is not broken, look for a further bounce with targets at 0.7420 and 0.7445 in extension.
The black line shows the pivot point. Currently, the price is above the pivot point, which is a signal for long positions. If it remains below the pivot point, it will indicate short positions. The red lines are showing the support levels, while the green line is indicating the resistance levels. These levels can be used to enter and exit trades.
Resistance levels: 0.7420, 0.7445, and 0.7490.
Support levels: 0.7260, 0.7245, and 0.7220.
The material has been provided by InstaForex Company - www.instaforex.com