
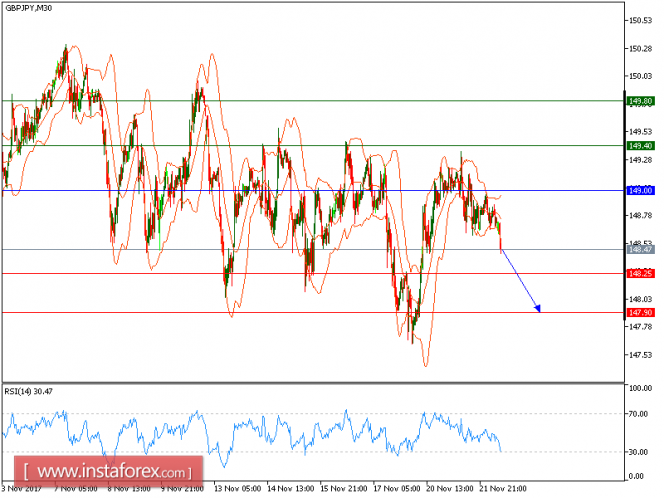
GBP/JPY is expected to trade with bearish outlook. The pair showed a lack of upward momentum as it is trading below both 20-period and 50-period moving averages. It has reached the lower Bollinger band, calling for a higher possibility of accelerating to the downside. The first downside target is set at 148.25. A break below this level would open a path toward 147.90.
Alternatively, if the price moves in the direction opposite to the forecast, a long position is recommended above 149.00 with the target at 149.40.
Strategy: SELL, Stop Loss: 149, Take Profit: 148.25
Chart Explanation: the black line shows the pivot point. The price above the pivot point indicates long positions; and when it is below the pivot points, it indicates short positions. The red lines show the support levels and the green line indicates the resistance levels. These levels can be used to enter and exit trades.
Resistance levels: 149.40, 149.80 and 150.35
Support levels: 148.25, 147.90, and 147.15
The material has been provided by InstaForex Company - www.instaforex.com