
Gold price continues to trade within the trading range of $1,270-$1,297. Gold remains above short-term cloud support, however the entire rise so far does not look impulsive. The best case for bulls is a move to $1,300-$1,310 before a decline to $1,210-$1,250.
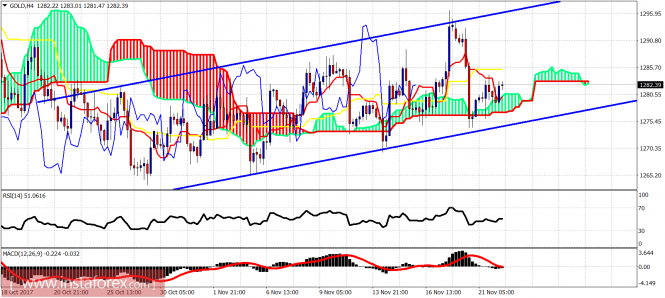
Gold price is trading above the 4-hour Kumo (cloud) support. Support is at $1,280 and next at $1,275. Resistance is at $1,285 and the next at $1,295. Gold price since late October has an overlapping structure which makes me believe that the metal is still inside a bigger correction phase.
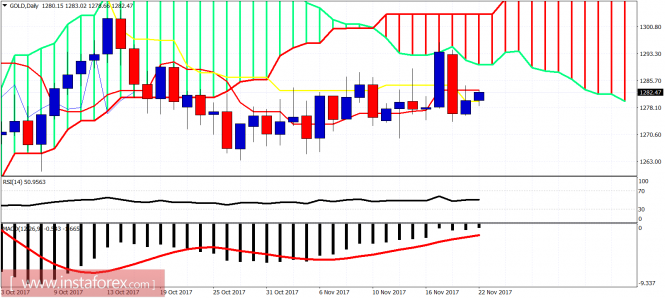
In the daily chart, Gold got rejected off the Daily Kumo (cloud) and dropped below the tenkan- and kijun-sen. Gold is now trying to break above both indicators. A daily close above $1,285 will open the way for a move back towards the lower cloud boundary at $1,290. I remain longer-term bullish but I believe we could get a better buying opportunity for Gold 30-50$ lower.
The material has been provided by InstaForex Company - www.instaforex.com