MG Network

something big isHappening!

In the mean time you can connect with us with via:

Copyright © Money Grows Network | Theme By Gooyaabi Templates

Money Grows Network

Archive

Powered by Blogger.

Welcome To Money Grows Network

Verified By

2006 - 2019 © www.moneygrows.net

Investments in financial products are subject to market risk. Some financial products, such as currency exchange, are highly speculative and any investment should only be done with risk capital. Prices rise and fall and past performance is no assurance of future performance. This website is an information site only.

Popular

Pages

Expert In

Name*


Message*

Ichimoku indicator analysis of gold for October 2, 2017

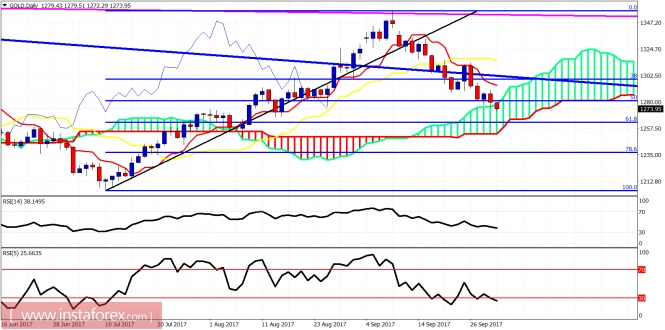
Gold price is making new lows early this week. I continue to consider this pullback as a corrective one inside a larger bullish trend. The decline from $1,291 is to be completed today and a reversal at least towards $1,285 is to be seen this week.

analytics59d1e7eaec9e8.jpg

Black line - resistance trend line

Blue lines - bullish divergence signs

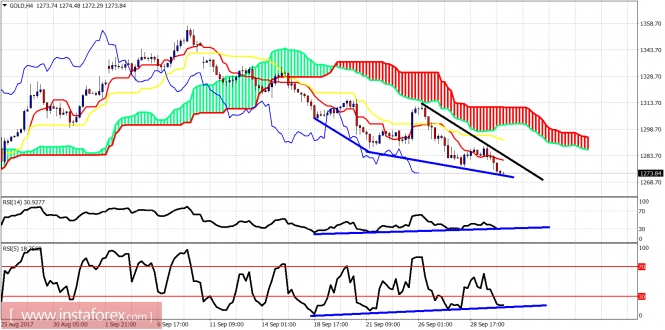
Gold price is trading below both the tenkan- and kijun-sen (red and yellow lindicators). Trend is bearish on the 4-hour chart. Bullish divergence signs continue to be given each time a new low is made. Short-term resistance is at $1,285. Breaking above it will push price towards $1,298 at least. Support is at $1,270.

analytics59d1e84855fb8.jpg

On a daily basis Gold price is testing the daily Kumo (cloud). Price is just below the 50% retracement of the rise and could reach the 61.8% Fibonacci retracement. Daily support is now at $1,260-55. Resistance is at $1,293. My longer-term view remains bullish.The material has been provided by InstaForex Company - www.instaforex.com