
Technical outlook:
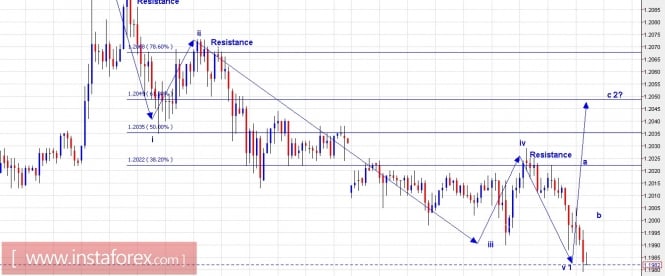
An extremely short time frame, 15 minutes, has been presented here for a short entry in EUR/USD. The pair rallied past 1.2070 levels marginally last week and print highs at 1.2092 levels before pulling back lower again. Now if you look at the short term wave count, EUR/USD has dropped 5 waves between 1.2092 and 1.1972 levels. This could probably be the beginning of a meaningful correction, that can drag prices lower towards 1.1640 levels at least. If the above wave count discussed is correct, EUR/USD could be unfolding into an expanded flat. A short entry can be initialized again on a pullback or counter trend rally towards 1.2040/50 levels going ahead. As depicted here, that would be wave 2 (a-b-c) into making, before wave 3 could begin lower. Please note that immediate resistance is seen through 1.2020/30 levels, while interim support is seen at 1.1970 levels respectively.
Trading plan:
Please look to sell again around 1.2030/40 levels, stop above 1.2092, target at 1.1900, 1.1800 and lower.
GBPUSD chart setups:
Technical outlook:
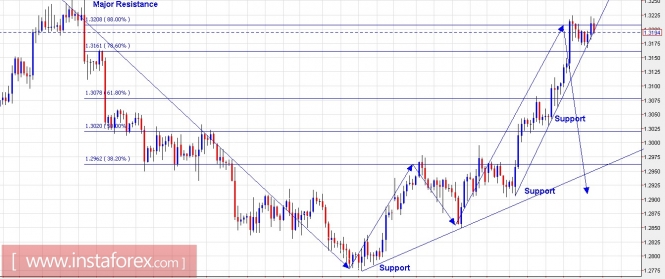
A 4H chart setup has been presented here for GBP/USD with a simple interpretation of waves, support-resistance, and fibonacci ratios. Looking into the waves first, the drop from 1.3270 through 1.2770 levels can be still considered as primary drop towards the larger trend. Furthermore, the counter trend rally towards 1.3220/30 levels, which has unfolded into 3 waves still looks corrective. Besides, note that prices are stalling at fibonacci 88.0% resistance of the entire previous drop and is also looking to produce an engulfing bearish candlestick pattern at this moment. A break below 1.3170 and subsequently below the counter trend line support would confirm that a major top has been formed in GBP/USD and that the pair should be looking aggressively lower from here.
Trading plan:
Please remain short again around current price of 1.3188, stop above 1.3270, target is lower.
Fundamental outlook:
There are no major fundamental events lined up for today.
Good luck!
The material has been provided by InstaForex Company - www.instaforex.com