
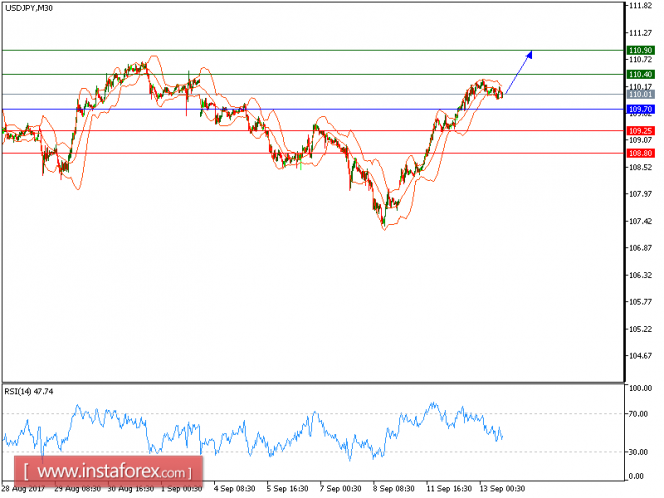
Our initial target which we predicted in our previous analysis has been hit. USD/JPY is expected to trade with a bullish bias above 109.70. The pair is supported by the rising trend line since September 8, which confirmed a positive outlook. The upward momentum is further reinforced by both ascending 20-period and 50-period moving averages. The relative strength index is bullish and calls for a new upside.
Hence, as long as 109.70 is not broken, look for another advance to 110.40 and even to 110.90.
Alternatively, if the price moves in the opposite direction, a short position is recommended below 109.70 with a target at 109.25.
Chart Explanation: The black line shows the pivot point. The current price above the pivot point indicates a bullish position, while the price below the pivot point is a signal for a short position. The red lines show the support levels and the green line indicates the resistance level. These levels can be used to enter and exit trades.
Strategy: BUY, Stop Loss: 109.70, Take Profit: 110.40
Resistance levels: 110.40, 110.90, and 111.35 Support Levels: 109.25, 108.80, 108.30
The material has been provided by InstaForex Company - www.instaforex.com