
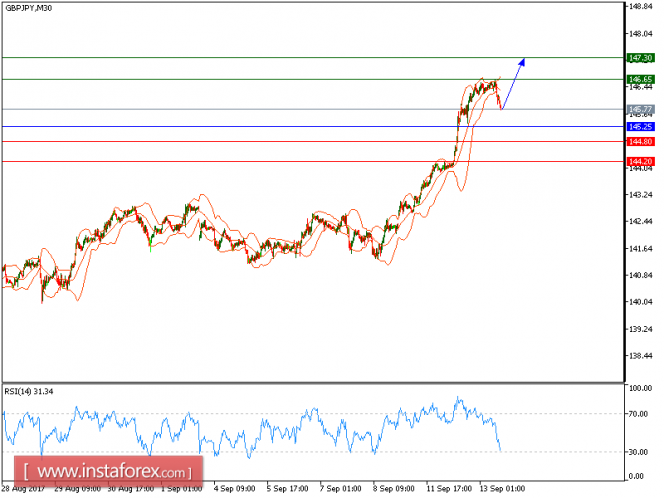
All our targets which we posted in our targets have been hit. The pair remains supported by its rising trend line on an intraday basis. The 20-period moving average is heading upward, and should continue to push the prices higher. Moreover, the relative strength index is bullish, and calls for further upside.
In which case, above 145.25, look for further advance to 146.65 and 147.30 in extension.
Alternatively, if the price moves in the direction opposite to the forecast, a short position is recommended below 145.25 with the target at 144.80.
Strategy: BUY, Stop Loss: 145.25, Take Profit: 146.65.
Chart Explanation: the black line shows th-e pivot point. The price above the pivot point indicates the bullish position; and when it is below the pivot points, it indicates a short position. The red lines show the support levels and the green line indicates the resistance levels. These levels can be used to enter and exit trades.
Resistance levels: 146.65, 147.30, and 147.80
Support levels: 144.80 144.20, and 143.55
The material has been provided by InstaForex Company - www.instaforex.com