
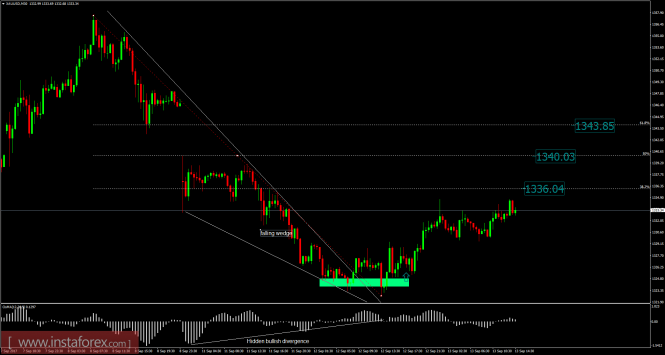
Recently, Gold has been trading upwards. As I expected, the price tested the level of $1,334.67. According to the 30M time frame, I found a broken falling wedge formation (bullish) in the background, which is a sign that selling looks risky. There is also a confirmed hidden bullish divergence on the moving average oscilator, which is another sign of strength. I placed Fibonacci retracement levels to potential targets. I got FR 38.2% at the price of $1,336.00, FR 50% at the price of $1,340.00 and FR 61.8% at the price of $1,343.00. Watch for buying opportunities.
Resistance levels:
R1: 1.3315
R2: 1.3325
R3: 1.3330
Support levels:
S1: 1.3300
S2: 1.3290
S3: 1.3280
Trading recommendations for today: watch for potential buying opportunities.
The material has been provided by InstaForex Company - www.instaforex.com