MG Network

something big isHappening!

In the mean time you can connect with us with via:

Copyright © Money Grows Network | Theme By Gooyaabi Templates

Money Grows Network

Archive

Powered by Blogger.

Welcome To Money Grows Network

Verified By

2006 - 2019 © www.moneygrows.net

Investments in financial products are subject to market risk. Some financial products, such as currency exchange, are highly speculative and any investment should only be done with risk capital. Prices rise and fall and past performance is no assurance of future performance. This website is an information site only.

Popular

Pages

Expert In

Name*


Message*

Ichimoku indicator analysis of USDX for September 28, 2017

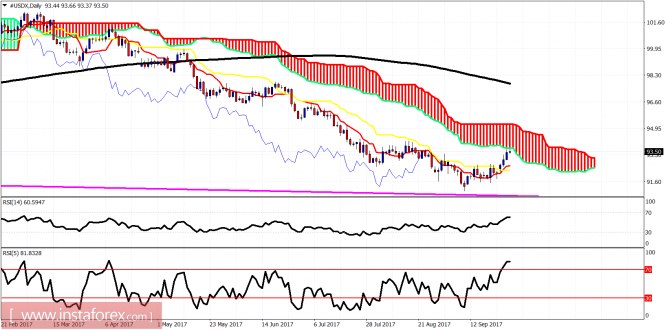
The US dollar index remains in a bullish short-term trend. Price target mentioned in our last analysis has been achieved. There are also signs of bearish divergence providing a warning for dollar bulls.

analytics59cc9d0ba034f.png

Red lines - bullish channel

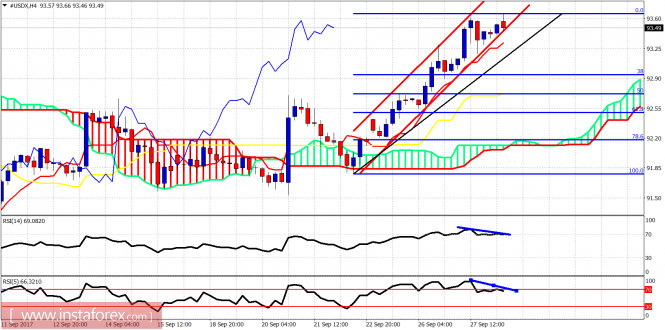
The US dollar index is inside the bullish channel. Both RSI indicators are diverging. Price could make a pullback towards 92.95 which is the short-term support and the 38% Fibonacci retracement of the latest rise. Cloud support is at 92.20. As long as we trade above it, the short-term trend is bullish.

analytics59cc9d60760c2.png

As expected, the dollar index has reached the Ichimoku cloud resistance. Price is above both the tenkan-sen and kijun-sen but below the Kumo (cloud). Trend is bullish in the short-term but in medium-term the trend remains bearish. This bounce is still considered as a short-term correction to the bigger downward trend. I expect price to get rejected and provide new lows towards 90.The material has been provided by InstaForex Company - www.instaforex.com