MG Network

something big isHappening!

In the mean time you can connect with us with via:

Copyright © Money Grows Network | Theme By Gooyaabi Templates

Money Grows Network

Archive

Powered by Blogger.

Welcome To Money Grows Network

Verified By

2006 - 2019 © www.moneygrows.net

Investments in financial products are subject to market risk. Some financial products, such as currency exchange, are highly speculative and any investment should only be done with risk capital. Prices rise and fall and past performance is no assurance of future performance. This website is an information site only.

Popular

Pages

Expert In

Name*


Message*

Ichimoku indicator analysis of Gold for September 7, 2017

Gold price remains in a bullish trend. Price pulled back towards $1,330 support and held above it. There are still chances of a pullback towards $1,300 over the coming weeks but overall we remain bullish.

analytics59b0ef8544f4b.jpg

Price in the 4-hour chart has broken below the tenkan-sen (red line indicator). This is not a good sign but as long as price holds above the kijun-sen (yellow line indicator) at $1,330, we could see another move to new highs closer to our 2nd target of $1,350.

analytics59b0efc50db08.jpg

Magenta line - trend line resistance

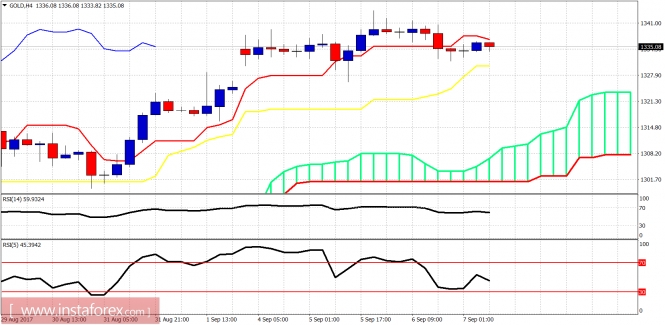
Blue line - trend line support

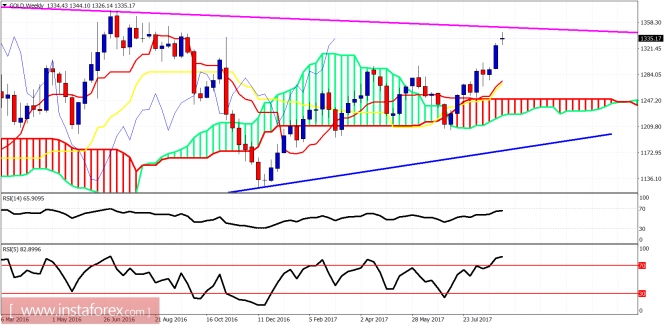
The weekly trend is bullish as price is above both tenkan- and kijun-sen. Price is approaching our target of the magenta trend line at $1,350. A pullback towards $1,300 is possible or at least towards $1,320. I remain bullish in the longer term.

The material has been provided by InstaForex Company - www.instaforex.com