
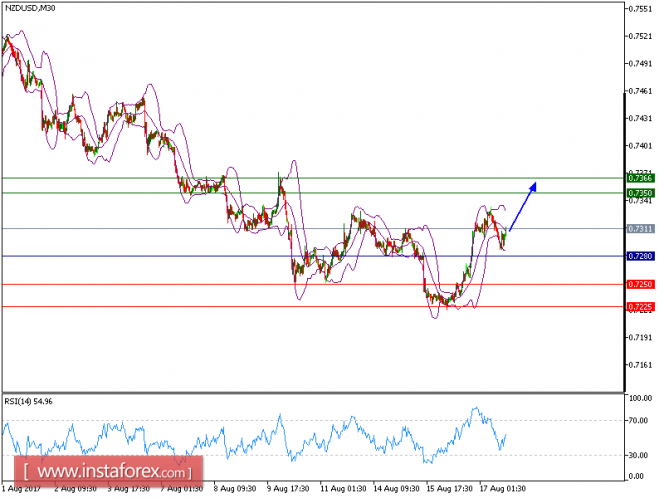
NZD/USD is expected to trade in higher range. The pair is trading above its ascending 20-period and 50-period moving averages, which play support roles and maintain the bullish bias. The relative strength index is supported by a rising trend line.
To sum up, as long as 0.7280 is not broken, further upside to 0.7350 and even to 0.7365 seems more likely to occur.
The black line shows the pivot point. Currently, the price is above the pivot point which indicates the bullish position. If it remains below the pivot point, it will indicate the short position. The red lines show the support levels and the green line indicates the resistance levels. These levels can be used to enter and exit trades.
Resistance levels: 0.7350, 0.7365, and 0.7400
Support levels: 0.7250, 0.7225, and 0.7175
The material has been provided by InstaForex Company - www.instaforex.com