
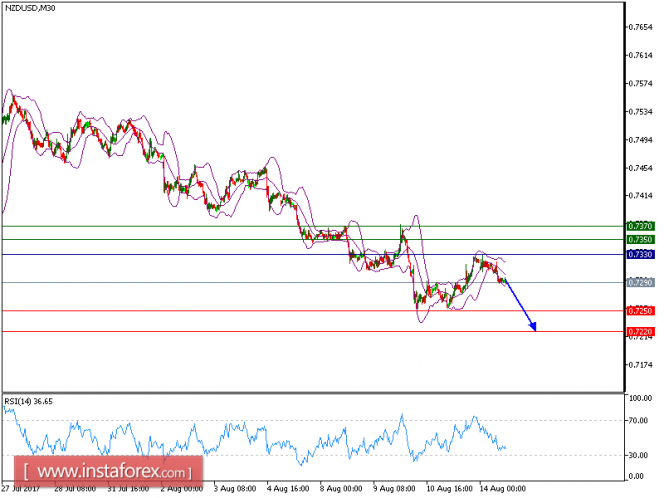
NZD/USD is under pressure and expected to trade in lower range. The pair broke below its 50-period moving average, which is playing a resistance role, and is consolidating on the downside. The relative strength index is below its neutrality level at 50 and lacks upward momentum. Even though a continuation of the technical rebound cannot be ruled out, its extent should be limited.
As long as 0.7330 holds on the upside, look for a further drop towards 0.7250 and even 0.7220 in extension.
The black line shows the pivot point. Currently, the price is above the pivot point which indicates the bullish position. If it remains below the pivot point, it will indicate the short position. The red lines show the support levels and the green line indicates the resistance levels. These levels can be used to enter and exit trades.
Resistance levels: 0.7350, 0.7370, and 0.7405
Support levels: 0.7250, 0.7220, and 0.7180
The material has been provided by InstaForex Company - www.instaforex.com