
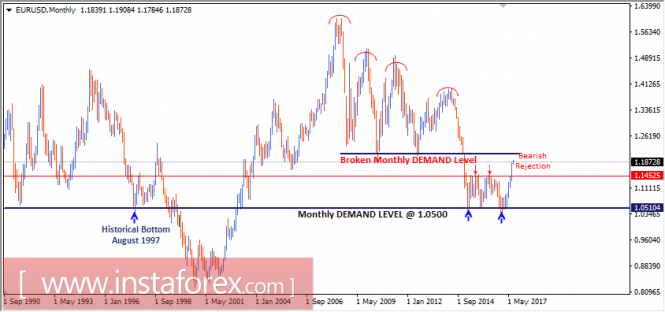
Monthly Outlook
In January 2015, the EUR/USD pair moved below the major demand levels near 1.2100 (multiple previous bottoms set in July 2012 and June 2010). Hence, a long-term bearish target is projected toward 0.9450.
In March 2015, EUR/USD bears challenged the monthly demand level around 1.0500, which had been previously reached in August 1997.
In the longer term, the level of 0.9450 remains a projected target if any monthly candlestick achieves bearish closure below the depicted monthly demand level of 1.0500.
The EUR/USD pair was trapped within the depicted consolidation range (1.0500-1.1450) until the current bullish breakout was executed.
The current bullish breakout above 1.1450 allows a quick bullish advance towards 1.1850 and 1.2000.
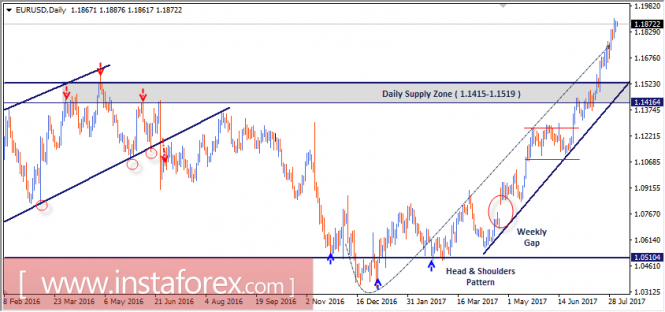
Daily Outlook
In January 2017, the previous downtrend reversed when the Head and Shoulders pattern was established around 1.0500. Since then, evident bullish momentum has been expressed on the chart.
As anticipated, the ongoing bullish momentum allowed the EUR/USD pair to pursue further advance towards 1.1415-1.1520 (Daily Supply-Zone).
The daily supply zone failed to pause the ongoing bullish momentum. Instead, an evident bullish breakout is being witnessed on the chart. The nearest supply level to meet the pair is located around 1.2080 (Level of previous multiple bottoms) where price action should be watched for a bearish pullback and a possible SELL entry.
On the other hand, the price zone of 1.1415-1.1520 stands as a prominent DEMAND zone to be watched if a bearish pullback occurs.
The material has been provided by InstaForex Company - www.instaforex.com