
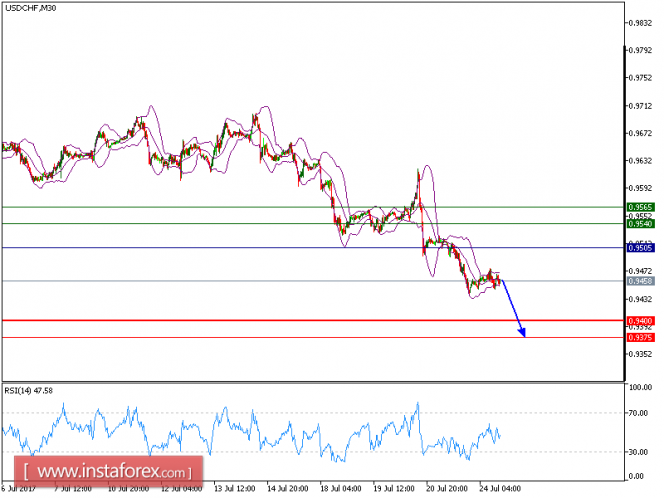
Our target which we predicted in our previous article has been hit. The pair is trading below its declining 20-period and 50-period moving averages, which play resistance roles and maintain the downside bias. The relative strength index is bearish and calls for another drop.
Hence, as long as 0.9505 is not surpassed, a further decline to 0.9400 and even to 0.9375 seems more likely to occur.
Chart Explanation: The black line shows the pivot point; the present price above pivot point indicates the bullish position and below pivot points indicates the short position. The red lines show the support levels and the green line indicates the resistance levels. These levels can be used to enter and exit trades.
Strategy: SELL, Stop Loss: 0.9505, Take Profit: 0.9400
Resistance levels: 0.9540, 0.9565, and 0.9595
Support levels: 0.940, 0.9375, and 0.9335
The material has been provided by InstaForex Company - www.instaforex.com