
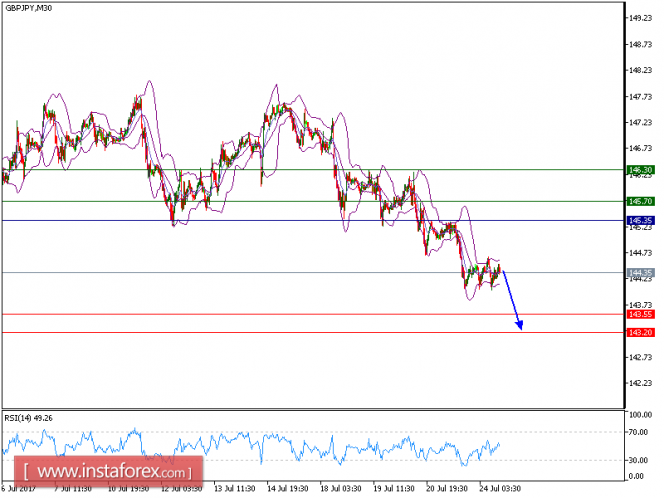
Our target which we described in our previous analysis has been hit. GBP/JPY is still under pressure and expected to trade downside. The pair broke below its former key support at 145.35, which becomes a key resistance now, and consolidated on the downside. The relative strength index is below its neutrality level at 50 and lacks upward momentum. The declining 50-period moving average is playing a resistance role and maintains the downside bias. As long as 146.35 holds on the upside, look for a further drop towards 143.55 and even 143.20 in extension.
Alternatively, if the price moves in the opposite direction as predicted, a long position is recommended above 145.35 with the target at 145.70.
Chart Explanation: the black line shows the pivot point. The price above pivot point indicates the bullish position and when it is below pivot points, it indicates a short position. The red lines show the support levels and the green line indicates the resistance levels. These levels can be used to enter and exit trades.
Strategy: SELL, Stop Loss: 145.35, Take Profit: 143.55.
Resistance levels: 145.70, 146.30, and 148.00
Support levels: 143.55, 143.20, and 142.45.
The material has been provided by InstaForex Company - www.instaforex.com