
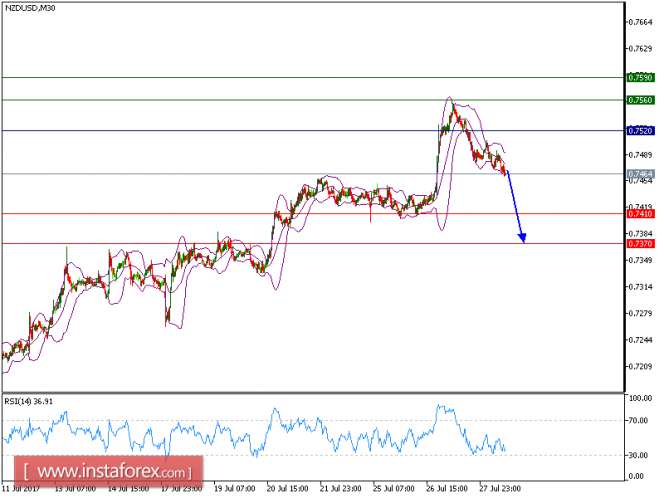
NZD/USD is under pressure. Although the pair broke above the 20-period moving average, it is still trading below its declining 50-period moving averages, which plays a resistance role. The relative strength index is below its neutrality level at 50. Even though a continuation of the technical rebound cannot be ruled out, its extent should be limited.
Hence, below 0.7520, expect a new drop to 0.7410 and even to 0.7370 in extension.
Strategy: SELL Stop Loss: 0.7410 Take Profit: 0.7370
Chart Explanation:
The black line shows the pivot point. Currently, the price is above the pivot point which indicates the bullish position. If it remains below the pivot point, it will indicate the short position. The red lines show the support levels and the green line indicates the resistance levels. These levels can be used to enter and exit trades.
Resistance levels: 0.7560, 0.7590, and 0.7630
Support levels: 0.7410, 0.7370, and 0.7335
The material has been provided by InstaForex Company - www.instaforex.com