
Technical outlook:
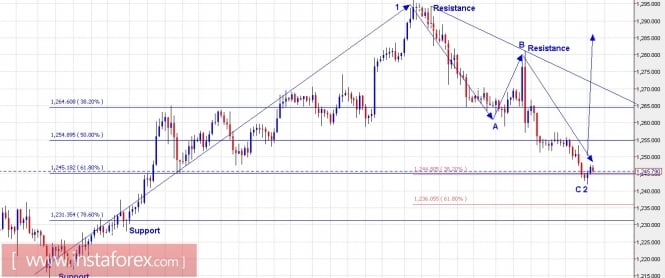
Gold has retraced lower towards fibonacci 0.618 support levels of the entire rally between $1,213 and $1,296 levels respectively. Furthermore, it is also a point of convergence of fibonacci 0.382 extensions of wave A, as depicted in Red around $1244.00 levels. Besides, please note that Wave A became equal to Wave C at $1,242/43 levels, which is an indication of wave C termination point. Speaking about the above convergences and also the wave counts, it looks like the yellow metal has completed wave 1 and 2 after printing lows at $1,241/42 levels yesterday. If this structure holds to be true, the next leg should be a rally from current levels toward at least $1,350.00. On the flip side, a drop below $1,241.00 might test $1,235.00 levels before turning higher again.
Trading plan:
Please remain long now, stop around $1,230.00 target $1,350.
US Dollar Index chart setups:
Technical outlook:
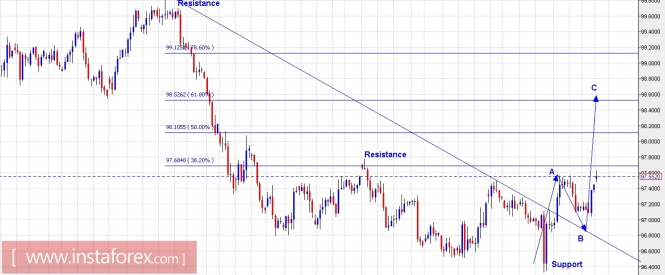
The US Dollar Index is seen to be trading at 97.50 levels for now after breaking above the resistance line as seen here. Please note that the index might be unfolding into wave 4 corrective of a higher degree. It is expected to unfold into 3 waves A-B-C as depicted here. Ideally, prices should drop towards one more low and terminate into wave B, before turning higher towards wave C as depicted here. Looking into the wave structure, waves 3-3-5 could unfold before the medium-term drop could resume. Immediate resistance is seen at 97.80 levels while support is at 96.30 levels respectively. A safe strategy could be to remain flat for now and consider buy positions at a lower price near 97.00 levels. On the flip side, a continued push higher would indicate further higher targets around 99.00 levels.
Trading plan:
Please remain flat for now and consider buy positions around 97.00 levels, stop at 96.30, targeting 99.00 at least.
Fundamental outlook:
There is no major event lined up for the rest of the day.
Good luck!
The material has been provided by InstaForex Company - www.instaforex.com