Trading plan for 20/06/2017:
The last night on the financial markets was definitely peaceful. The main currencies record minor changes in value relative to the US dollar. EUR/USD is still trading in the range of yesterday's lows at 1.1160 and USD/JPY is trading around 111,60. The most important event of the Asian session is a rapid over 1% rally of the Nikkei 225, which surged to 22-month highs.
On Tuesday 20th of June, the event calendar is light in important economic releases, but global investors will pay attention to various speeches of the central bankers like Stanley Fischer and Rober Kaplan from the US FED, Mark Carney from the Bank of England, and Thomas Jordan from the Swiss National Bank. Durning the late US session, Canada will release Wholesales Sales data and the US will release Current Account data.
EUR/USD analysis for 20/06/2017:
This week will be full of speeches from US FED policymakers. For the beginning, vice chairman of the Federal Reserve Stanley Fischer and President of Federal Reserve Bank of Dallas Robert Kaplan will give speeches during the US trading session. Nevertheless, their comments might not be enough. Market valuation of the Fed's tightening pace is still insufficient despite the hawkishness of the last meeting. Market will close at the end of 2018 with two hikes fewer than suggested by the consensus and 2019 does not discount anything in principle. This makes the interest rate market a gigantic space to respond to stimulus from the monetary authorities, the economy, and possibly Trump's administration. The area for the decline in debt yields for each of these reasons is very limited. The speculative position on USD is also very low, which creates a significant field for a strong rebound.
This is why the views of FED vice president Fischer are always closely monitored and are indicative of the opinion of more hawkish FOMC members. Therefore, it is important to keep track of the timing of the start of the balance sheet restriction process.
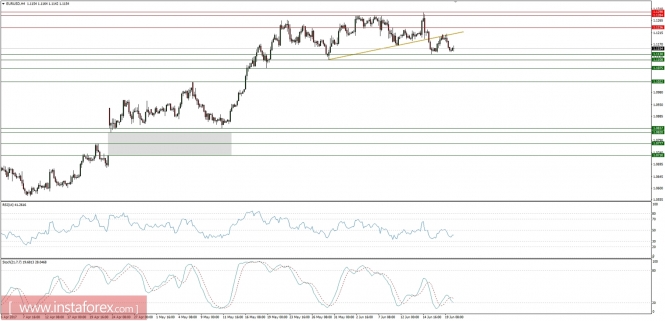
Let's now take a look at the EUR/USD technical picture on the H4 time frame. The price has been rejected twice from the level of 1.1208, just where the golden trend line resistance is, so any rally upwards is being capped. If the FED policymakers comments are hawkish again, the price might test the technical support at the level of 1.1130 - 1.1108. In a case of a breakout, we expect a move even lower towards the level of 1.1075. The technical resistance at the swing high at the level of 1.1298 is the most important resistance for the bulls.
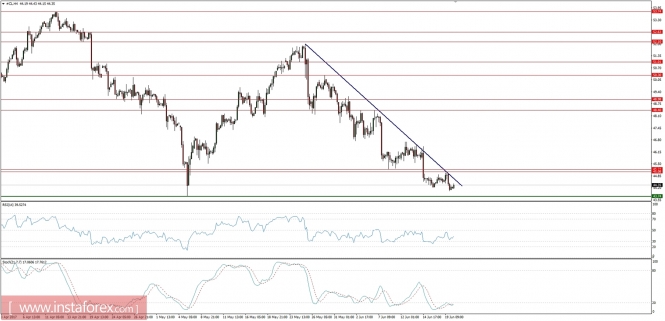
Market Snapshot: Crude Oil trading just above the last month's lows
Slowly but surely, the price of the oil is trading below the navy trend line above the level of $43.74. The market conditions are clearly oversold and the growing bullish divergence between the price and the momentum indicator suggest a possible Double Bottom technical pattern in progress. Any Violation of the May's low will invalidate this scenario and accelerate the sell-off.
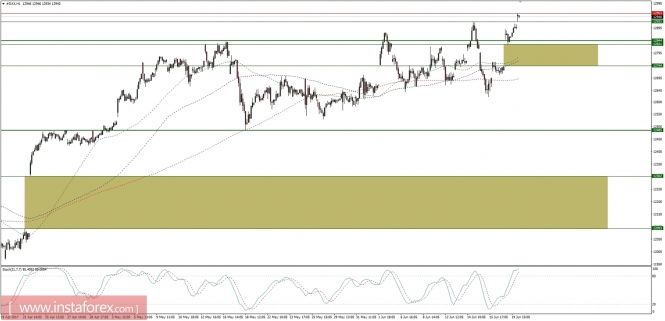
Market Snapshot: German DAX index on all-time highs
The German DAX stock index has made new all-time highs yesterday at the level of 12953 points. Nevertheless, despite the fact that the market is trading above all the moving averages, the market conditions are overbought on the hourly time frame, and at the higher timeframes, there is a clear bearish divergence visible. Moreover, the gap between the levels of 12744 - 12831 still hasn't been filled yet. Any breakout below the technical support at the level of 12921 might start a corrective pull-back to fill the gap.